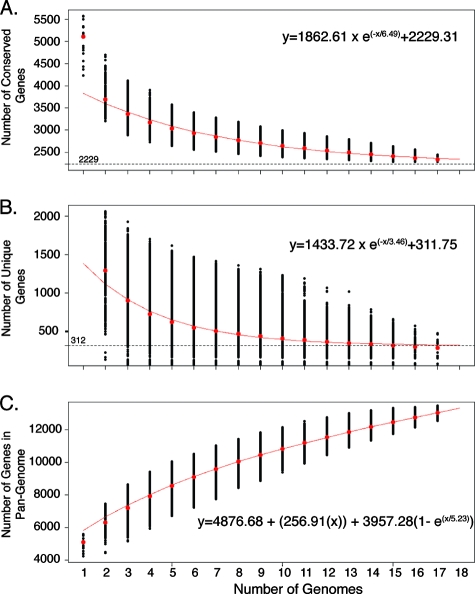
FIG. 4.
Conserved core, unique, and pangenome calculations for E. coli. (A) Each point indicates the number of genes that are conserved in genomes. The red line shows the exponential decay model based on the median value for conserved genes when increasing numbers of genomes were compared. (B) Decreasing number of unique genes in a genome with increasing number of genomes compared. The red line shows the exponential decay model based on the median value for unique genes when increasing numbers of genomes were compared. (C) Pangenome of the species E. coli. The extrapolated curve continues to increase, and thus E. coli has an open pangenome.

