FIG. 2.
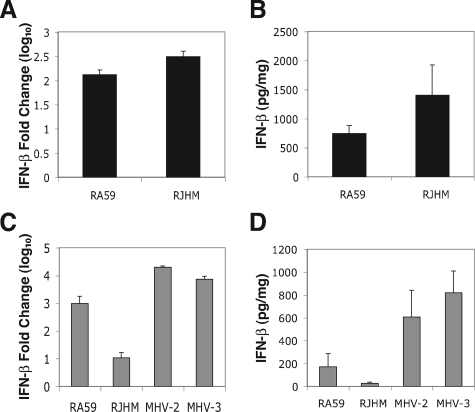
IFN-β induction in the brain and liver of MHV-infected mice. (A and B) C57BL/6 mice were infected with 50 PFU of RA59 or RJHM or mock-infected by i.c. inoculation. (A) RNA was isolated from brains at day 5 p.i. (RA59, n = 9; RJHM, n = 6; mock, n = 10), and IFN-β mRNA was measured by real-time qPCR. (B) Total protein was isolated from brains of infected mice at day 5 p.i. (RA59, n = 5; RJHM, n = 2; mock, n = 5), and IFN-β protein levels were measured using a mouse IFN-β ELISA. Data from panel A and B represent averages from two independent experiments and are replotted from Roth-Cross et al. (35). (C and D) C57BL/6 mice were infected with 500 PFU of RA59, RJHM, MHV-2, or MHV-3 or mock-infected by i.h. inoculation. (C) IFN-β mRNA and (D) IFN-β protein levels in livers at day 3 p.i. (RA59, n = 5; RJHM, n = 5; MHV-2, n = 3; MHV-3, n = 4; mock, n = 5). IFN-β mRNA data are represented as relative induction over mock-infected animals. IFN-β protein data are normalized by subtraction of IFN-β protein levels in mock-infected animals (IFN-βinfected − IFN-βmock). Error bars represent the standard error of the mean, and data are derived from one representative experiment of two.

