FIG. 1.
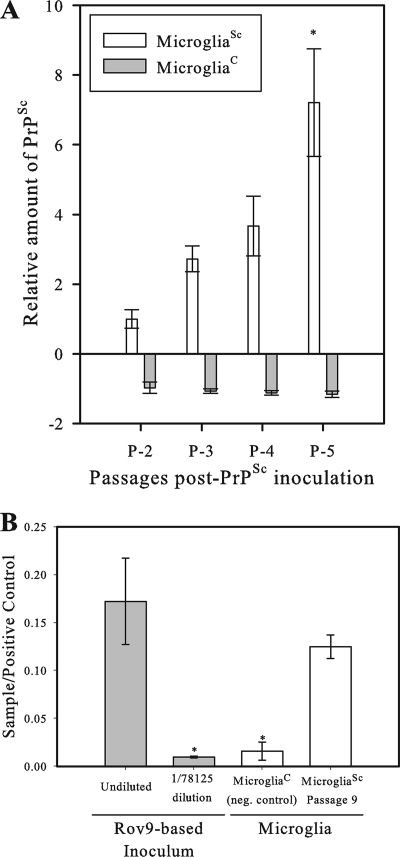
PrPSc accumulation in primary microglia. Primary sheep microglia were inoculated in triplicate with either PrPSc-containing (microgliaSc) or PrPSc-lacking (microgliaC) cell lysates derived from the PrPSc-positive or -negative Rov9 cell line (60), respectively, and then serially passaged. Lysates of microgliaSc were assayed for PrPSc by commercial ELISA, and the corrected optical density was determined. The equation for the corrected optical density is OD450 − OD620 (OD450 being the optical density at 450 nm) per the manufacturer's instructions. (A) ELISA results comparing the level of PrPSc in late-passage (five passages after PrPSc inoculation [P-5]) microgliaSc versus early passage (P-2) microgliaSc. Data were normalized using a standard curve. MicrogliaSc results were set at 1, and all other results were normalized to this value (y axis). Each value represents the mean ± 1 standard deviation (error bar). Results for microgliaSc at P-5 and P-2 were compared by a statistical analysis, and the microgliaSc values at P-5 and P-2 were significantly different (P < 0.005) as indicated by an asterisk. (B) ELISA results comparing the relative level of PrPSc in late-passage (P-9) primary microgliaSc to the original inoculum. Data were normalized to the ELISA plate positive control (y axis) to account for plate-to-plate variation between testing repeats performed at different times. Results for microgliaSc at passage 9 were compared to the values for microgliaC and both Rov9Sc-based inoculum data points. The values for P-9 microgliaSc were significantly different (P < 0.05) from those for microgliaC and the diluted RovSc data points, as indicated by an asterisk. neg. control, negative control.

