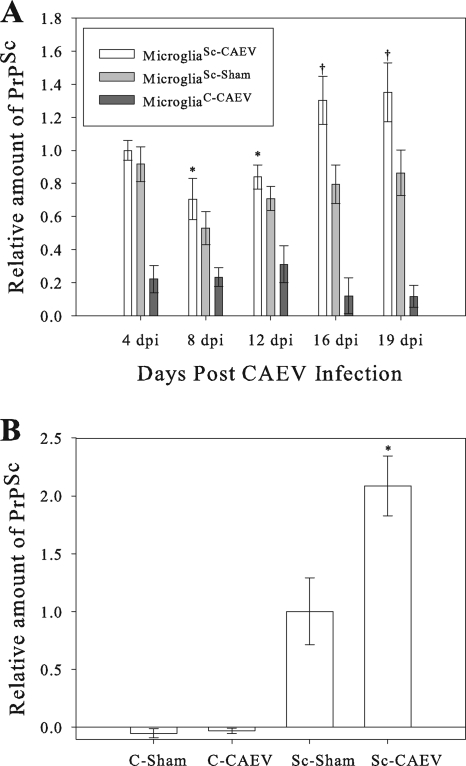
FIG. 5.
Effects of CAEV coinfection on PrPSc accumulation in primary sheep microglia and transmission of microglia-derived PrPSc to primary microglial cells. (A) PrPSc accumulation in the culture supernatant of primary microglia infected with CAEV after establishment of PrPSc accumulation. MicrogliaSc and microgliaC were inoculated with CAEV, and cell culture supernatants were collected at 4, 8, 12, 16, and 19 days after CAEV inoculation (dpi). Aliquots of supernatant were analyzed by an ELISA for PrPSc levels, which were normalized via a standard curve. Normalized 4 dpi microgliaSc-CAEV levels were set at 1, and all other results were normalized based on this value (y axis). Six replicates for each treatment group were used. At each time point, results for microgliaSc-CAEV were compared to the results for microgliaSc-Sham in a statistical analysis; microgliaSc-CAEV values that were significantly different from microgliaSc-Sham values are indicated as follows: *, P < 0.05; †, P < 0.0005. (B) PrPSc levels in the lysates of primary microglia simultaneously coinfected with PrPSc and CAEV. MicrogliaC were inoculated with the 4 dpi culture supernatants from the previous experiment: Sc-CAEV, Sc-Sham, C-CAEV, and C-Sham. At 26 dpi, cell lysates were analyzed by an ELISA for PrPSc levels, which were normalized via a standard curve. Normalized microgliaSc-Sham levels were set at 1, and all other results were normalized to this value (y axis). Three replicates for each treatment group were used. Results for microgliaSc-CAEV were compared to the results for microgliaSc-Sham and evaluated statistically; the microgliaSc-CAEV value that was significantly different (P < 0.01) from the microgliaSc-Sham value is indicated by an asterisk. Each error bar represents 1 standard deviation.

