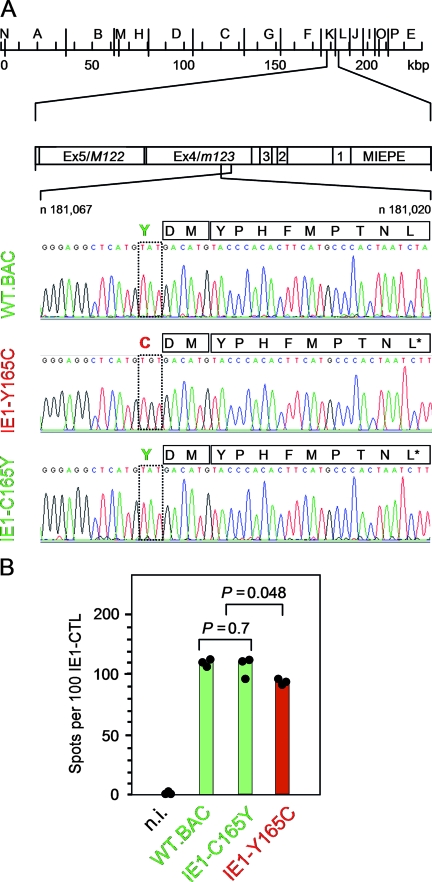
FIG. 1.
Identification of the mutation Y165C at the N-terminal proteasomal cleavage site of the antigenic IE1 peptide precursor. (A) Sequencing of the IE1 peptide-coding region of BAC plasmids. Sequencing was originally undertaken with the intention to verify codon CTT specifying Leu at the C-terminal MHC class I anchor position of the antigenic IE1 peptide in single-nucleotide-tagged IE1-A176L* revertants of the epitope deletion mutant IE1-L176A (76). This revealed an unintended surplus mutation of codon TAT into codon TGT, replacing Tyr with Cys at amino acid position 165 of the IE1 protein, which is position −3 relative to the N terminus of the antigenic IE1 peptide 168-YPHFMPTNL-176. (Top) HindIII physical map of the mCMV-WT.Smith genome (20, 63) with the MIE region shown expanded. Exons (Ex) are numbered. MIEPE, MIE promoter and enhancer. (Bottom) Sequencing of the region ranging from nucleotide (n)181,067 to n181,020 within exon 4/m123 on the complementary strand (C strand), drawn in twisted orientation. Signals from nucleotides A, T, G, and C are shown in green, red, black, and blue, respectively. Mutated amino acid positions and viruses are highlighted by red lettering, and WT and revertant amino acid positions and viruses are highlighted by green lettering. Amino acids within the region of interest (position −3 to position 9 relative to the N terminus of the antigenic IE1 peptide) are given in one-letter code. (B) Presentation of the naturally processed IE1 peptide on MEF infected under conditions of selective and enhanced IE gene expression (MOI, 4; cycloheximide was replaced after 3 h by actinomycin D) with the viruses indicated. n.i., uninfected MEF. Shown are data from a gamma interferon secretion-based ELISPOT assay using IE1 epitope-specific CTL as effector cells and the IE-phase-arrested infected MEF as stimulator cells. The filled circles represent data (spot counts per 100 IE1-CTL seeded) of triplicate assay cultures, and the bars represent the median values. Green labeling and red labeling indicate absence and presence of the mutation, respectively. P values (two-sided), determined by the distribution-free (nonparametric) Wilcoxon-Mann-Whitney rank sum test, are indicated.

