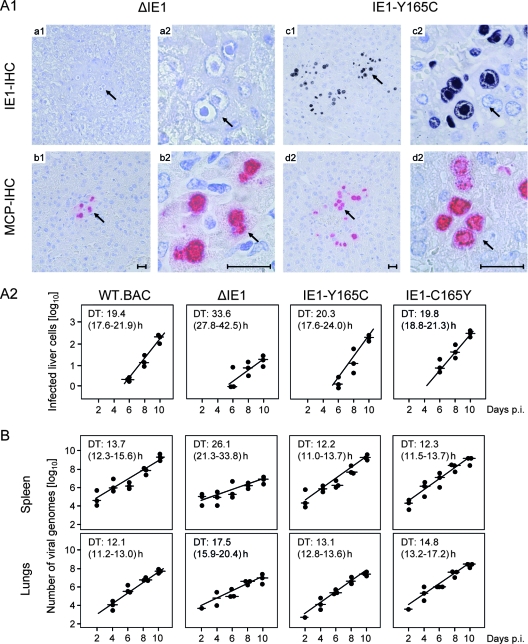
FIG. 6.
Viral replicative fitness in host tissues. (A1) Immunocompromised BALB/c mice were infected with 105 PFU (corresponding to ∼5 × 10⁷ viral genomes) of the deletion mutant mCMV-ΔIE1 (images a1 to b2) or of the point mutant mCMV-IE1-Y165C (images c1 to d2). On day 10 after infection, liver tissue sections were analyzed by IHC staining of intranuclear IE1 protein (IE1-IHC, black) and of intranuclear MCP (MCP-IHC, red). The index 1 images (a1 to d1) provide overviews of section areas of ∼0.5 mm2. The arrows point to sites of interest that are resolved to greater detail in the corresponding index 2 (a2 to d2) images. The bar markers represent 50 μm. Note the absence of IE1 protein in the intranuclear inclusion bodies of hepatocytes infected with the deletion mutant mCMV-ΔIE1 (image a2). (A2) Quantitation of liver infection in the time course of viral spread. Plotted are semilogarithmic growth curves for the indicated viruses based on the numbers of infected, MCP+ liver cells counted in representative 10-mm2 liver tissue section areas. The solid circles represent data from individual mice, with the median values marked by horizontal lines. The DTs and their 95% confidence intervals (given in parentheses) are calculated from the slopes a (95% confidence intervals of a) of the calculated log-linear regression lines according to the following formula: DT = log 2/a. (B) DTs of the viral-DNA load in spleen and lungs. The numbers of viral genomes per 106 tissue cells were quantified by real-time PCR specific for the viral gene M55(gB) normalized to the cellular gene pthrp. For further explanation, see the legend to panel A2. p.i., postinfection.

