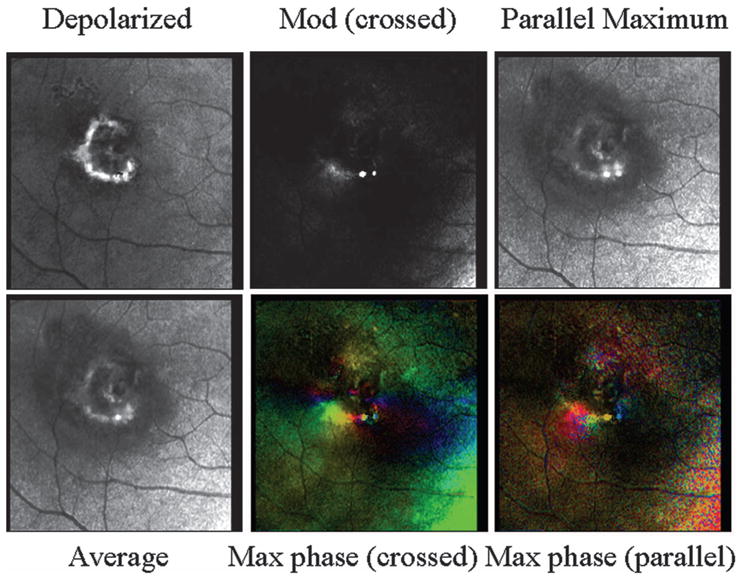
Fig. 11.

Polarimetry images of the patient from Fig. 10 on a scale sufficiently small so as not to include the lesion components outside the main well-defined lesion. (Top left) Depolarized light image, emphasizing deeper features and with retinal vessels seen as absorbing structures and the rim of the CNV appearing bright compared with neighboring retina. This region compares well with the near-IR image in Fig. 10 but is larger in diameter than the active edge of the lesion in the angiography images. Both the depolarized light image and the right-column images from Fig. 10 correspond to the dark border around the CNV in the angiography images. There is a central component also seen in all but the gray-scale birefringence image. (Top center) Average of all 40 images, showing more fluid leakage and a more distinct central component of the membrane. (Top right) Maximum of the parallel detector, emphasizing superficial features, emphasizing the superficial features. (Bottom left) Birefringence image, lacking typical macular cross and showing the lower-left edge of the border of the exudation. (Bottom middle) Cardinal directions scale map of phase of the maximum phase of the crossed detector. Note the lack of symmetry about the fovea, but the strong color change in the lower-left portion of the lesion. There is also a color change in the central lesion component. (Bottom right) Cardinal directions scale map of phase of the maximum phase of the parallel detector, showing findings similar to those of the crossed detector map.
