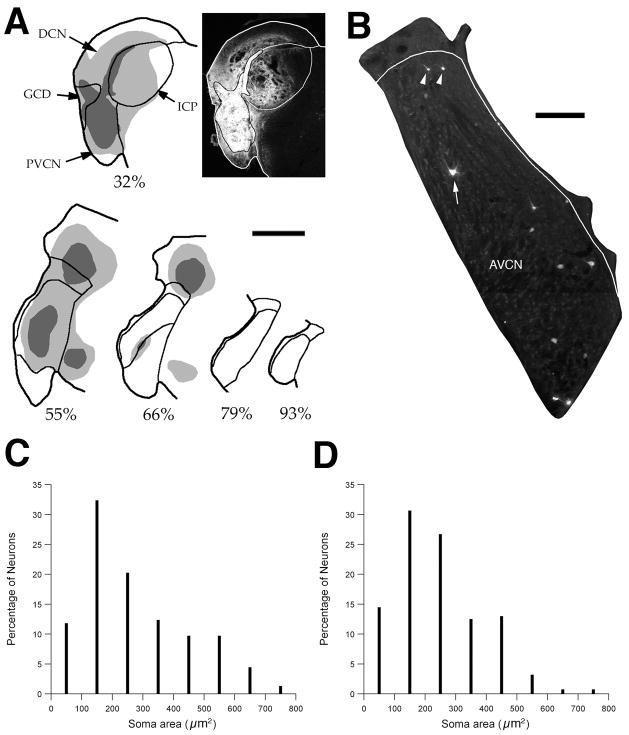
Figure 3.
Experiment 1: Labeling of VCN multipolar cells that project to the contralateral CN. Data for panels A-C were taken from one rat that received a FB injection in the left CN. (A) FB injection site in the CN. The location of each section through the CN along the anterior/posterior axis is expressed as a percentage of the total length of the CN (0% equals the posterior border of the DCN). The “core” portion of the injection site is shown as dark gray and the “halo” is light gray (see text). These two regions are illustrated for one section through the DCN and PVCN in the photograph to the right of the drawing. Scale bar equals 1mm. (B) Fluorescent micrograph of a section through the contralateral CN shows several FB-labeled cells. Large (arrow) and small (arrowhead) commissural multipolar cells were labeled. Border of GCD is drawn in white. Scale bar equals 200 μm. (C) Size histogram for FB-labeled cells (191 cells). (D) Size histogram for VCN cells labeled in a different rat that received an injection of FG in the left CN (204 cells). The similar size distributions in the two panels indicate that they are independent of the tracer used to label these neurons. Abbreviations: AN: auditory nerve; AVCN: anterior ventral cochlear nucleus; ICP: inferior cerebellar peduncle; PVCN: posterior ventral cochlear nucleus.

