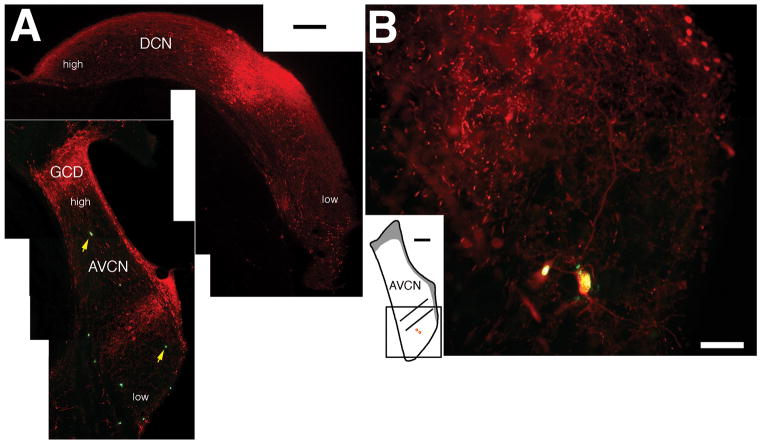
Figure 4.
Results from a rat that received a DiY injection in the left CN and a BDA injection in the right DCN. (A) Fluorescent micrographs of two coronal sections display the BDA injection site (red) in the right DCN (top) and the pattern of labeling in the ipsilateral VCN. The location of VCN and DCN neurons that respond best to high or low frequencies is indicated. Injections that are confined to a narrow portion of the DCN frequency axis produce a stripe of BDA labeling in the corresponding frequency region of the VCN. Several DiY-labeled cells can also be seen scattered within the VCN and two are indicated by arrows. The photograph of the AVCN was produced by aligning photomontages of the two types of labeling and then combining the images. Scale bar equals 200 μm. (B) Fluorescent photomicrograph displaying two double-labeled cells. The location of both cells with respect to the stripe of BDA label is shown in the inset. Scale bar equals 50 μm. Abbreviations are defined in the legend for figures 1 and 2.

