
Figure 2.
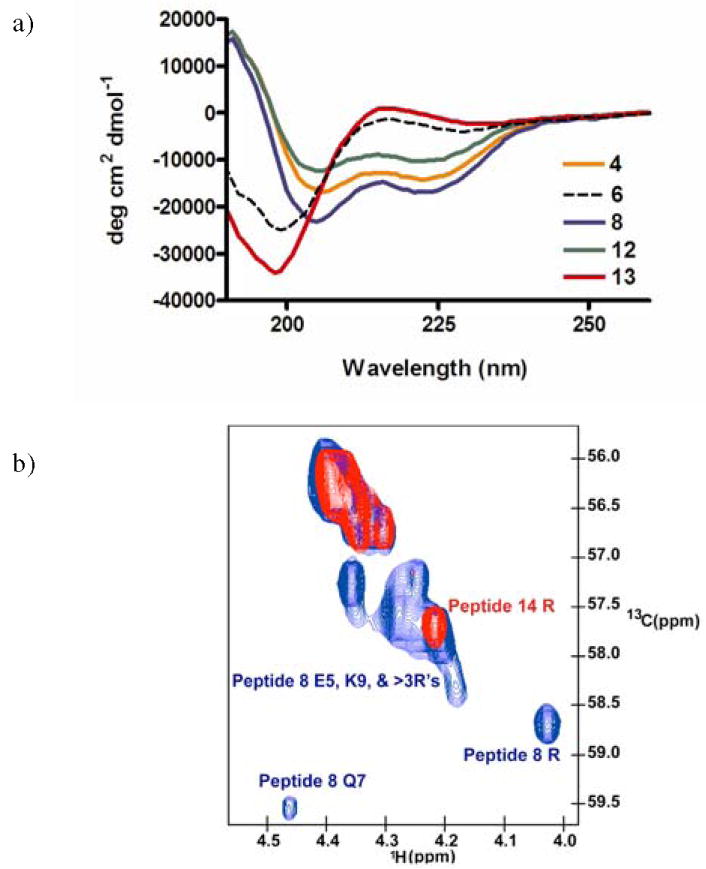
Structure of R6QR7 Peptidomimetics. (a) CD spectra of selected peptidomimetics and unconstrained control peptide (13). CD spectra were recorded at 4°C in 10mM sodium phosphate, 100mM KF, pH 7.5. (b) Natural abundance 13C HSQC comparing chemical shifts in the Cα-Hα region between peptide 8 (blue) and uncyclized peptide 14 (red).