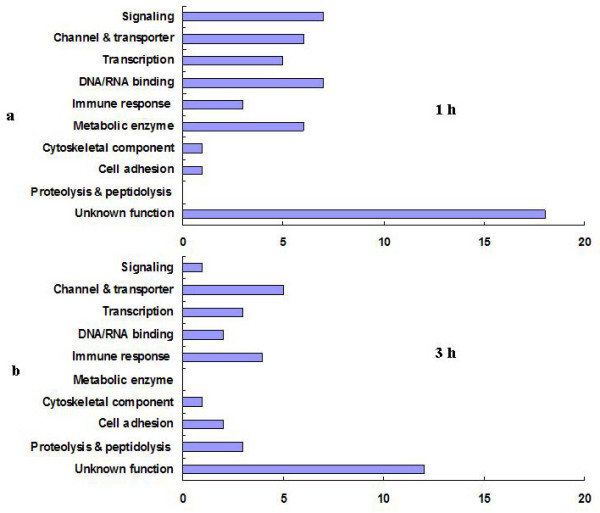
Figure 3.

Functional classification of the bursicon-regulated genes at 1 and 3 h post r-bursicon injection. The classification is based on gene ontology data in the FlyBase in conjunction with a homolog search using the BLAST data in FLIGHT and functional protein domains in InterPro. The numbers along the horizontal axis indicate the transcript numbers.
