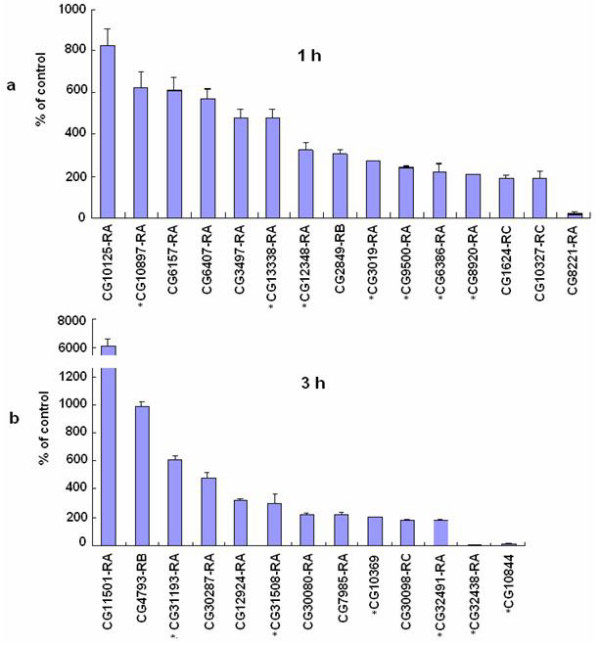
Figure 4.

qPCR verification of the randomly selected bursicon-regulated genes identified by microarray. The ligated flies were injected with 0.5 μl r-bursicon heterodimer and the control flies received r-bursicon α protein only. See Methods for RNA extraction, PCR amplification, reverse transcription and mRNA quantification protocols. a. Genes regulated 1 h after r-bursicon injection. b. Genes regulated 3 h after r-bursicon injection. The data represent the mean ± SE of three biological samples. *: these genes were randomly selected for temporal transcriptional profile analysis in Fig. 5 and Fig. 6.
