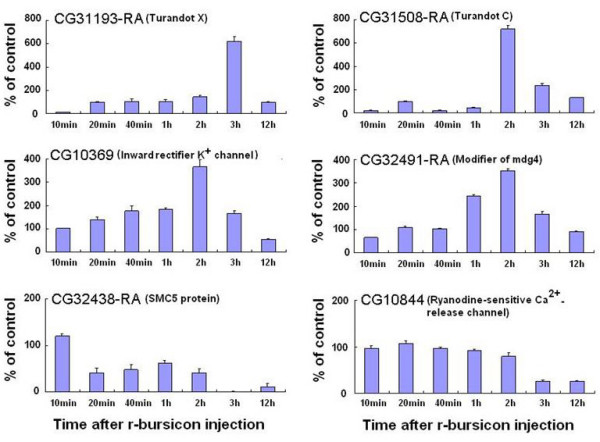
Figure 6.

Temporal transcriptional profiles of bursicon-regulated genes selected from 3 h microarray data. The neck-ligated flies were injected with 0.5 μl r-bursicon heterodimer and the control flies received r-bursicon α protein only. Total RNA was extracted from the treated and control flies at the indicated time periods post r-bursicon injection and subjected to qPCR analysis as described in Methods. The data represent the mean ± SE of three biological samples.
