
Figure 1. Breakdown of prior information for the 282 MCSG structures.
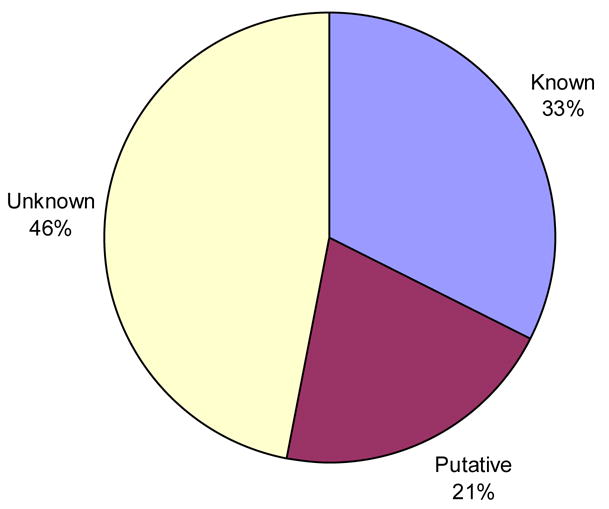
The pie chart illustrates the proportion of the 282 non-redundant structures classed as “known function”, “putative function” or “unknown function”.
Official websites use .gov
A
.gov website belongs to an official
government organization in the United States.
Secure .gov websites use HTTPS
A lock (
) or https:// means you've safely
connected to the .gov website. Share sensitive
information only on official, secure websites.
The pie chart illustrates the proportion of the 282 non-redundant structures classed as “known function”, “putative function” or “unknown function”.