
Figure 2.
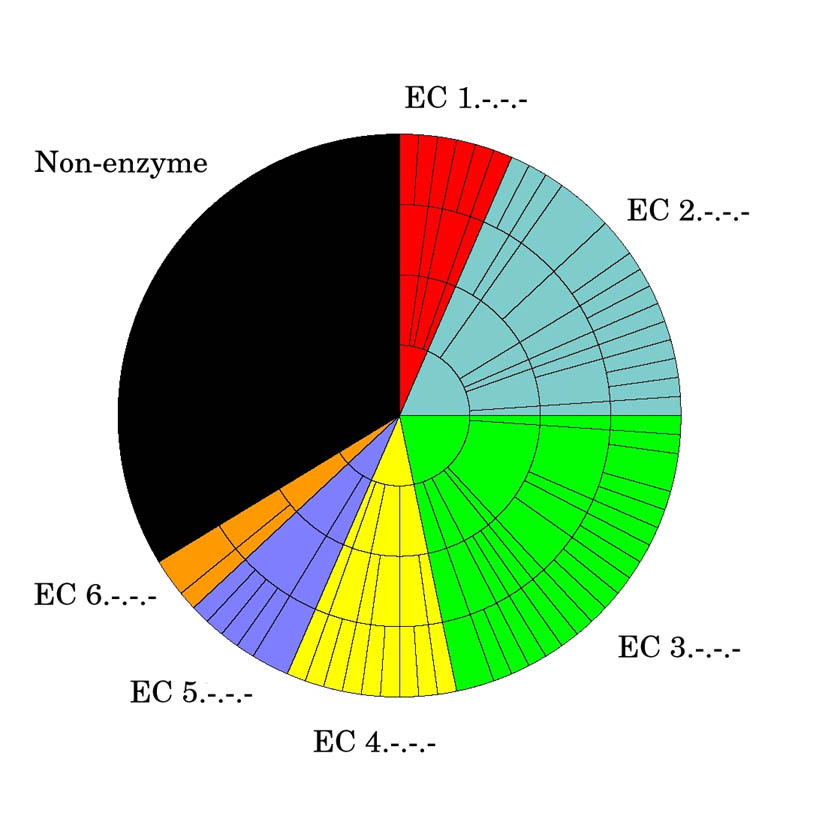
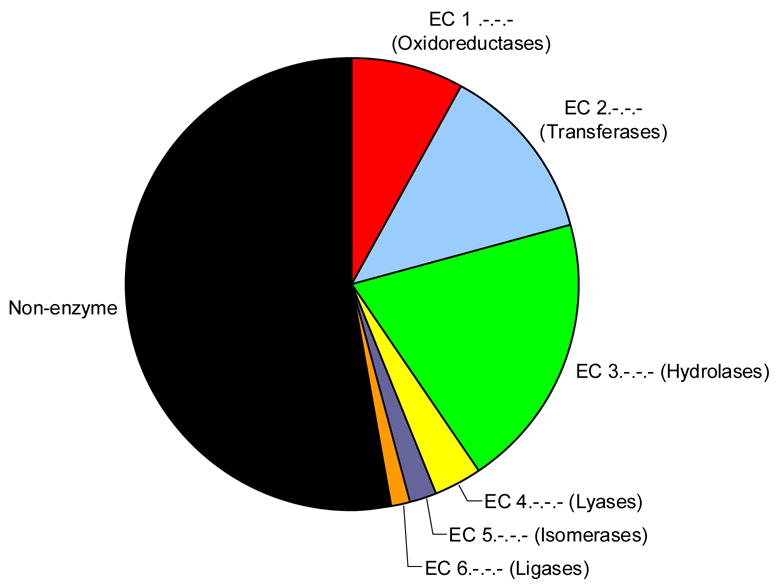
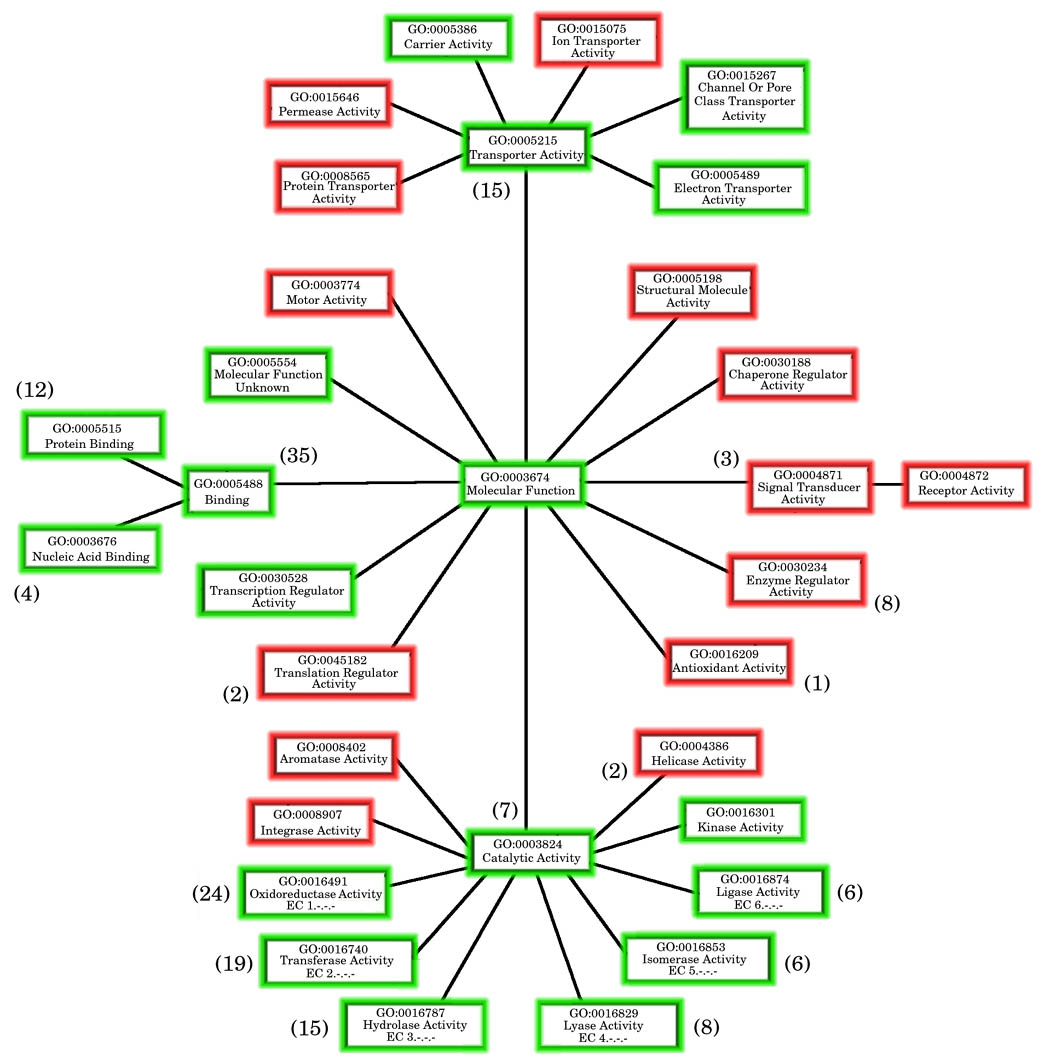
Figure 2a: EC wheel for 92 proteins of known function
- Red = E.C. 1.-.-.- (Oxidoreductases)
- Blue = E.C. 2.-.-.- (Transferases)
- Green = E.C. 3.-.-.- (Hydrolases)
- Yellow = E.C. 4.-.-.- (Lyases)
- Purple = E.C. 5.-.-.- (Isomerases)
- Orange = E.C. 6.-.-.- (Ligases)
Each shell then corresponds to the next stage down the E.C. schema through the second, third and finally the fourth level.
Figure 2b: Pie chart showing distribution of EC classes in the entire PDB
The proportions illustrated are taken from the numbers of PDB entries in the PDB with each top level E.C. number. This information is extracted from the Enzyme Structures Database at the EBI (http://www.ebi.ac.uk/thornton-srv/databases/enzymes/).
Figure 2c: Map showing the coverage of the generic GO-slim by the MCSG dataset
Any MCSG structures from the full dataset annotated with GO terms had all their GO-terms extracted and the associated GO-slim terms derived from the GOA-GOslim mapping file. All GO-slims from the “Molecular Function” branch of the gene ontology were mapped. Those GO-slim terms found in the annotations of the MCSG structures are coloured green whereas those coloured red are not covered by the MCSG dataset.
The numbers in brackets correspond to the number of terms added at that point in the hierarchy by the extended GO-slim and shows the spread of the additional information.