
Figure 4. ROC curves for SSM and SIT based on manual function assignment.
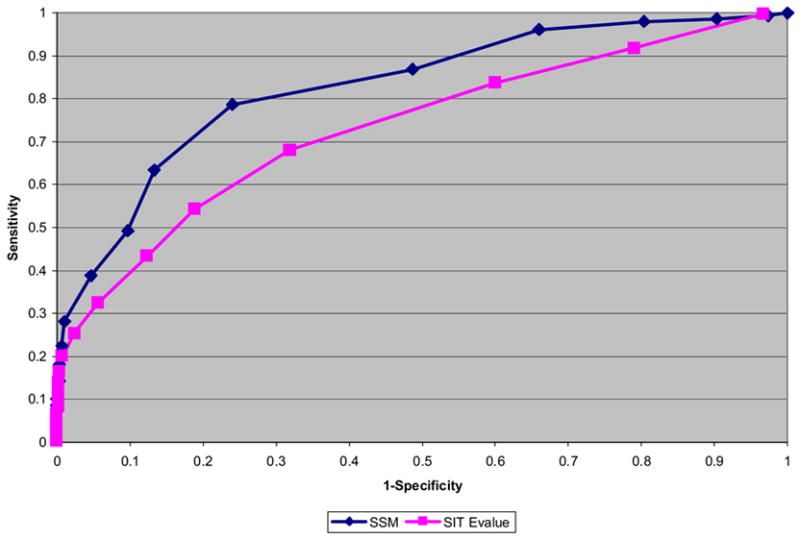
The ROC curves are plotted for SSM results and for SiteSeer (“reverse template”) results. The cut-off used by SSM is the Z-score of the hit, whereas it is the E-value that is of interest in SiteSeer (reverse templates). The ideal curve would rise vertically from the origin and then horizontally out to the right and would give an area under the curve of 1. The plot shows that the SSM Z-score appears to be a better measure for distinguishing between true and false positives than the SiteSeer (“reverse template”) measures.