
Figure 3.
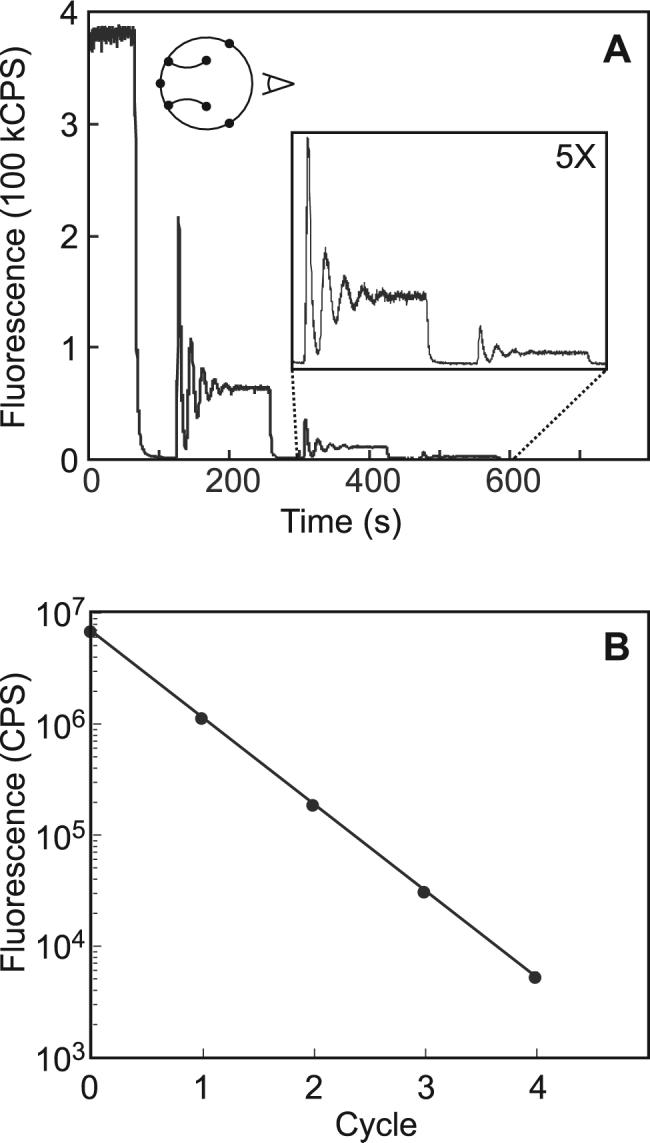
Quantitative evaluation of serial dilution. (A) Three consecutive serial dilutions of fluorescein dye solution (300 nM in TAE buffer) into TAE buffer were monitored using confocal fluorescence microscopy. The detector position is indicated in the inset circuit schematic. The second and third dilutions are shown in the five-fold magnified inset. Serial dilutions were performed by executing flush(100,60) followed by mix(100,120). (B) A standard curve for 10 μM fluorescein was constructed from the average fluorescence intensity of the sample concentrate, and the intensity obtained after each of four consecutive six-fold dilutions. Each data point represents the average of eight independent experiments. The log plot exhibits excellent linearity over the three detectable orders of magnitude (R2 = 0.999).