
Figure 6.
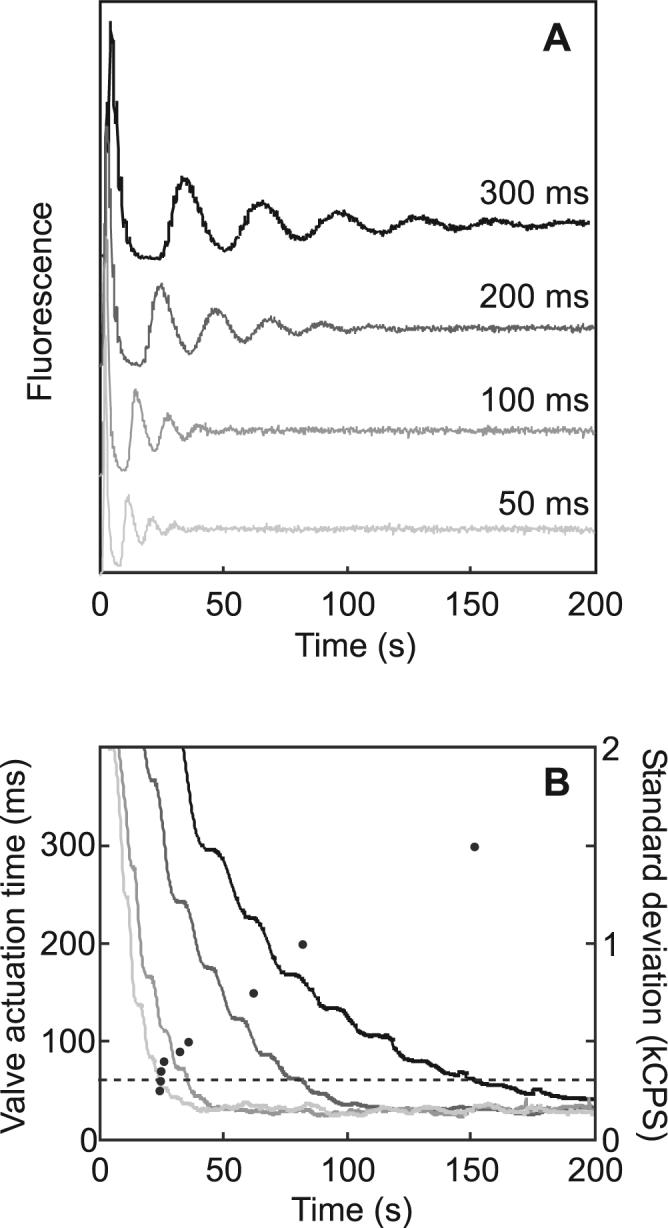
Mixing transients at variable valve actuation times. (A) Mixing transients were generated with variable actuation times and aligned to time t = 0. (B) Standard deviations as a function of time are plotted as solid lines, sampling valve actuation times of 300, 200, 100, and 50 ms. The standard deviation window width is the period of the oscillation for each transient. A dashed line at σwin = 300 CPS indicates the threshold for complete mixing. Mixing times (•) measured at different valve actuation times are plotted discretely with respect to the left axis. Mixing times determined by this method exhibited ∼5% standard error.