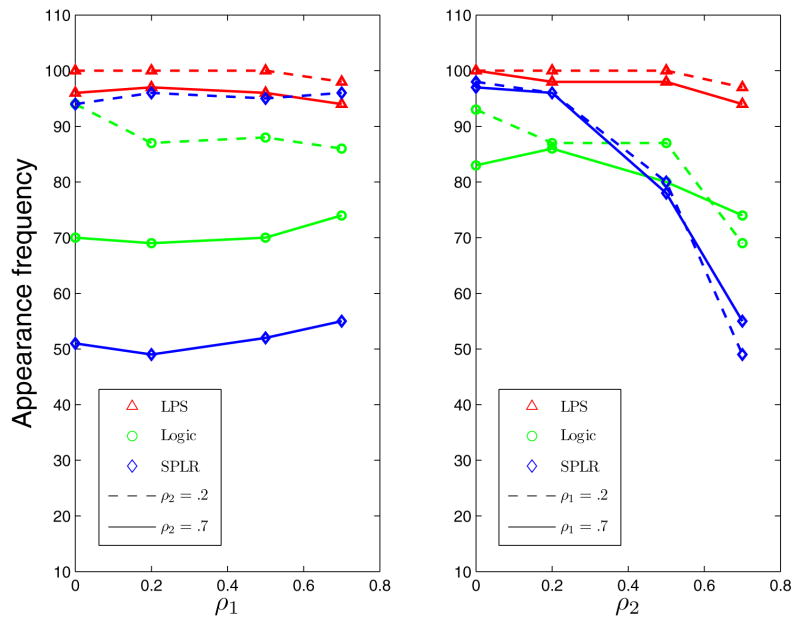
Figure 2.
Appearance Frequency of the High Order Pattern B1234 in Simulation Example 3. In the Left Panel, the x-Axis Is ρ1. ρ2 is 0.2 for the Dashed Line and 0.7 for the Solid Line. In the Right Panel, the x-Axis Is ρ2. ρ1 is 0.2 for the Dashed Line and 0.7 for the Solid Line. The Red Triangles Represent LPS, the Blue Diamonds Represent Logic Regression [27] and the Green Circles Represent SPLR [26].

