
Figure 1.
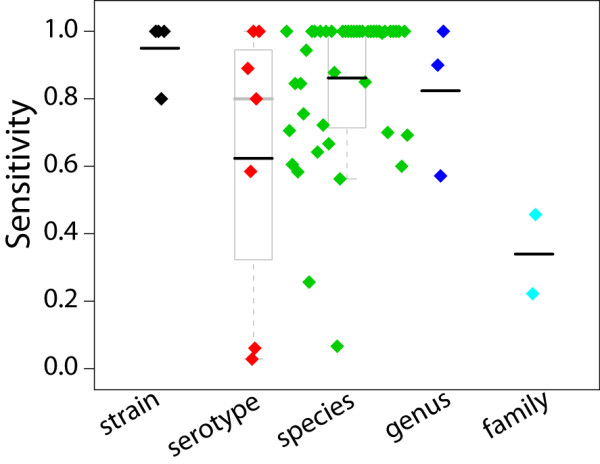
Sensitivity by taxonomy level. Each colored diamond represents a real-time PCR assay examined in this paper. Black bars indicate the mean, grey bars indicate the median. Top and bottom of each box indicates 75th and 25th percentiles, and grey lines at whisker ends denote min and max values. The wide ranging sensitivities demonstrate both inconsistency in genetic diversity at a given taxonomy level, and inconsistency in signature design approaches.