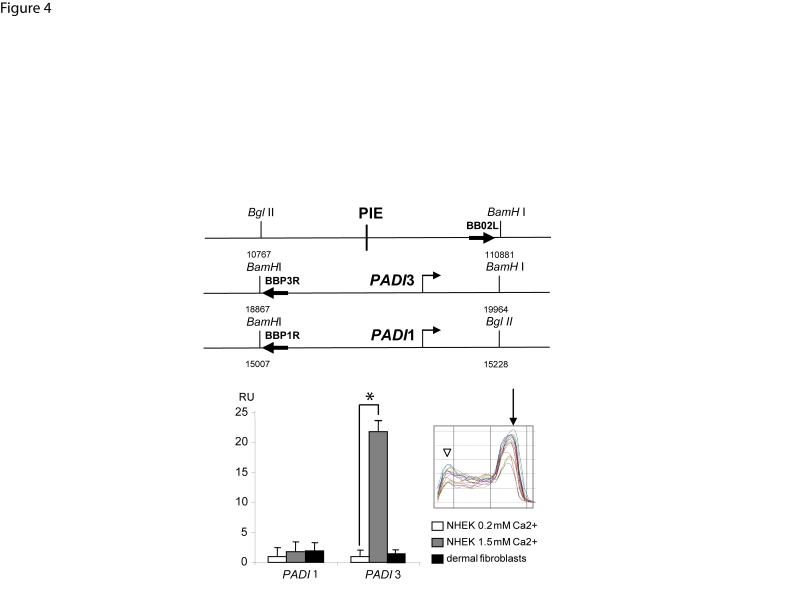
Figure 4. Increased frequency of interaction between PIE and the PADI3 promoter indicating chromatin looping.
The abundancy of chimeric DNA containing PIE and the promoter region of the genes PADI1 or PADI3 were explored by 3C analysis using specific primers (top). The levels of PIE-PADI3 promoter chimeric DNA in extracts from NHEKs grown in the presence of 1.5 mM calcium were approximately 20-fold greater than that in NHEKs grown in the presence of 0.2 mM calcium, or dermal fibroblasts. Amplification of BAC-based negative control for random association events (see methods) yielded no product (not shown). All amplifications were performed in triplicate wells. Results were normalized with respect to the abundancy of the PADI3 promoter sequence in the template. Data are expressed in Relative Units (RU) as means+/−SEM for 2 independent experiments, each performed in triplicate wells.*, p<0.05. Representative dissociation curves (inset) show the major amplimer peaks (arrow) along with secundary peaks (arrowhead) indicative of primer-dimer formation in some experiments. Such possible primer-dimer was not detectable in ethidium-bromide stained agarose gel of the end-point PCR reactions and did not seem to interfere with calibration curves.

