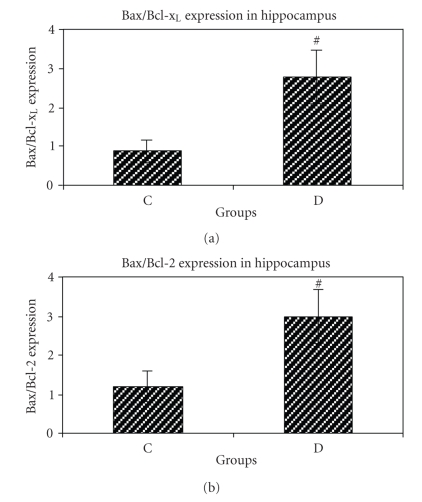
Figure 2.
(a) Bax/Bcl-xL ratio of control (C) and STZ-induced diabetic (D) groups of rat. Bar graph indicates the mean ± S.E.M.# P < .01, compared to the control group (n = 4 each group). (b) Bax/Bcl-2 ratio of control (C) and STZ-induced diabetic (D) groups. Bar graph indicates the mean ± S.E.M.# P < .05, compared to control group (n = 4 each group).

