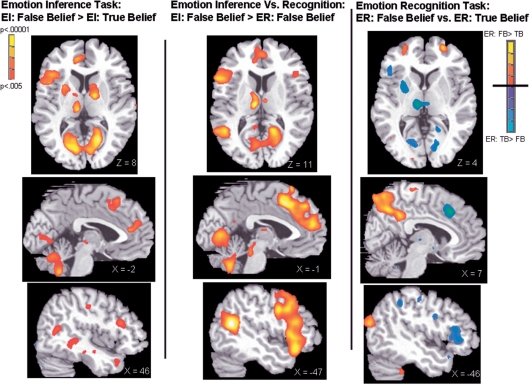
Fig. 2.
Neural activity for each contrast of interest. Data are shown at threshold, P < 0.005 to show full extent of activations. The far right panel shows activity for the Emotion Recognition task with significant activity for ER: False Belief > True Belief shown in red colors and ER: True Belief > False Belief shown in blue. All contrasts show IFG, thalamus and striatum activity on the axial slices. Medial prefrontal cortex is shown on the mid-sagittal slice and the somatosensory cortex is shown on the sagittal slices.

