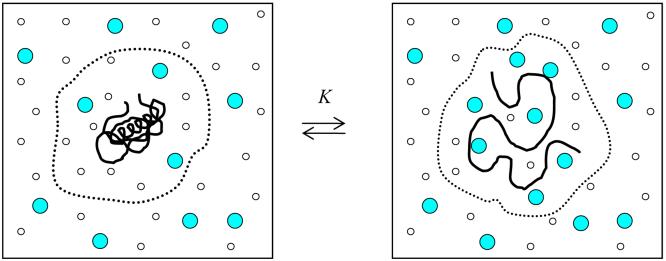
Figure 3.
A schematic representation of protein denaturation due to the increased preferential binding of a cosolvent (larger shaded circles) over water (small open circles) to the denatured state compared to the native state. The dashed line represents the region over which the local solution distribution (N3/N1) differs from the bulk solution distribution (n3/n1). Although the above figure represents a closed system, the local region can be considered an open system in contact with a large excess of bulk solvent which maintains a constant chemical potential between the local and bulk regions. This description is only appropriate when the biomolecule is at infinite dilution.

