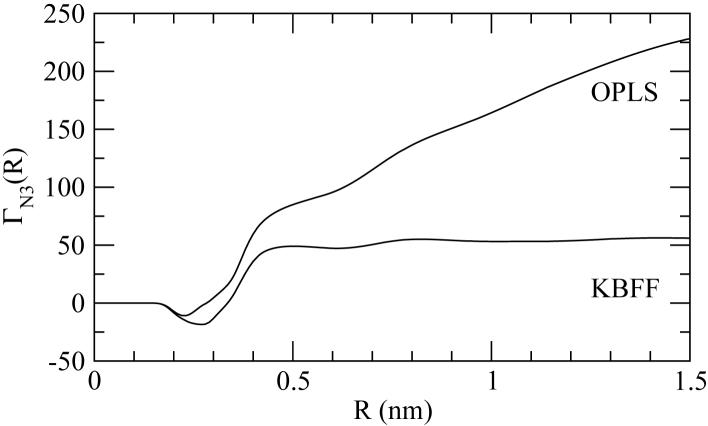
Figure 5.
The simulated preferential binding parameter (ΓN3) for 8M urea (3) and native lysozyme (N) at 300K and pH 7 as a function of integration distance from the protein surface (R). The simulated values have been obtained using the Gromos 45a3 parameters for lysozyme, the SPC water model, and either the KBFF of OPLS models for urea. Total simulation time was 6 ns. The experimental value is 16.

