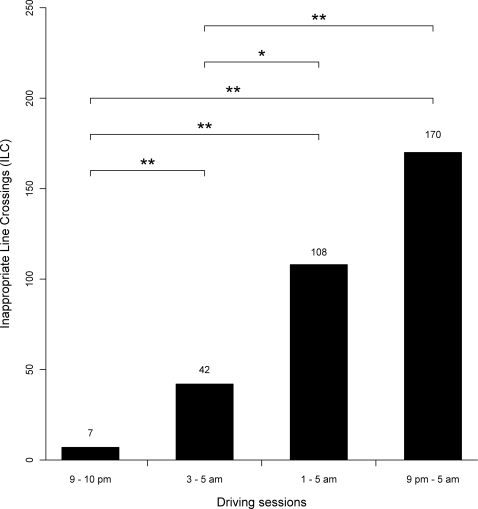
Figure 2. Cumulative number of inappropriate line crossings (ILC) for the 14 subjects in the last hour of the 3 nocturnal driving sessions (short, intermediate and long durations of driving), as well as the ILC for the reference drive (9–10 pm of the long drive).
Statistical analyses refer to Incidence rate ratios (IRR) with 95% confidence intervals (CI) using the short drive and the 9–10 pm drive as reference (See section results). * P<.05. ** P<.001.

