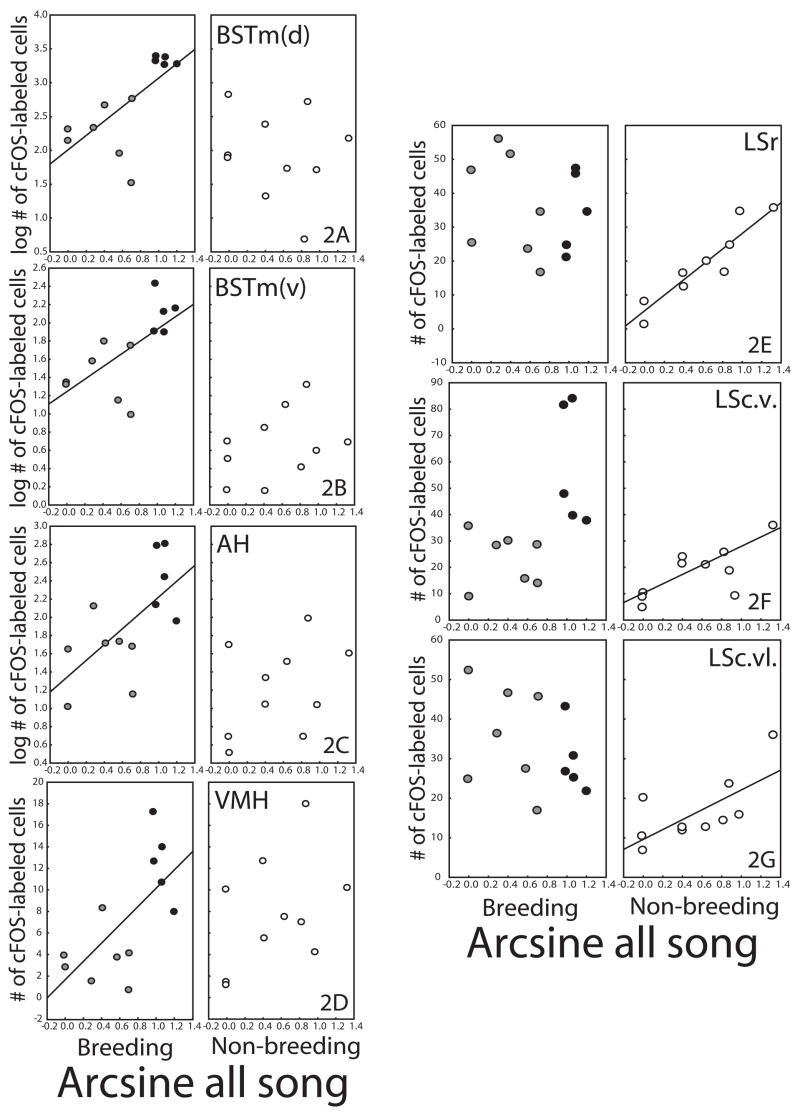
Figure 2.
Plots showing the relationships between song production and mean number of cFOS-labeled cells in (A) BSTm(d), (B) BSTm(v), (C) AH, (D) VMH, (E) LSr, (F) LSc.v., and (G) LSc.vl. in breeding and non-breeding condition males. Each point represents one individual. Black dots are breeding condition males with nestboxes; gray dots, breeding condition males without nestboxes; white dots, non-breeding condition males.

