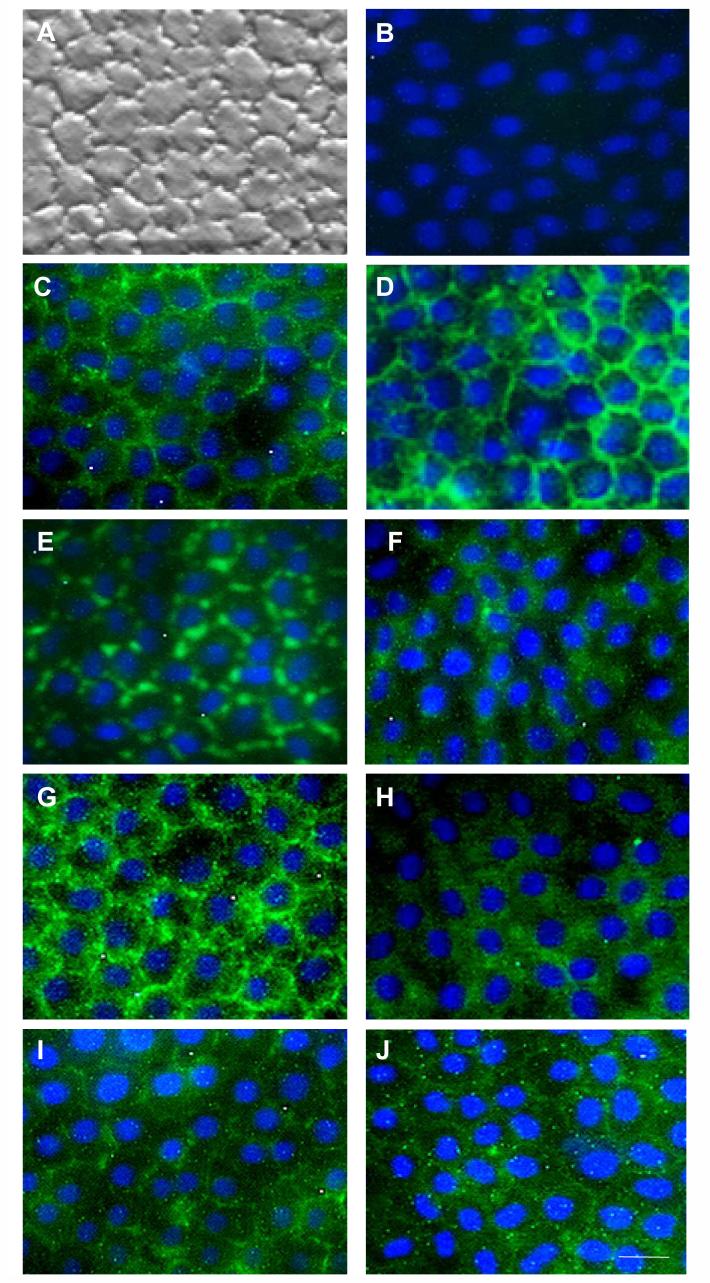
Figure 3. Cytolocalization of Junction Components Expressed by In Vivo HCECs.
As compared to hexagonal HCECs in vivo (A), cytolocalization was detected by immunofluorescence staining to phalloidin (C), N-cadherin (type I) (D), VE-cadherin (E), E-cadherin (type I) (F), β-catenin (G), p120 (H), p190 (I) and ZO-1 (J). Negative control using normal mouse serum or rat serum showed the same result as shown in (B). The color of nuclear counterstaining is blue. Magnification bar represents 100 μm.

