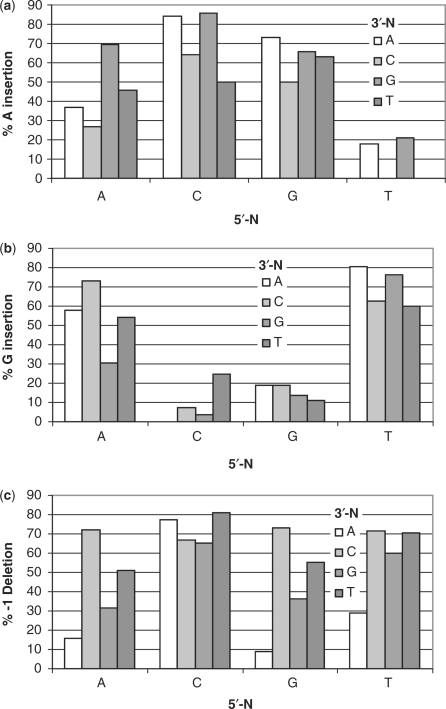
Figure 3.
Insertion and −1 deletion frequencies as a function of sequence context. (a) Percentage of A and (b) percentage of G insertion opposite F of all substitution mutations. (c) Percentage of −1 deletion of all −1 and substitution mutations. The base at the bottom refers to the 5′-N of 5′-NFN-3′, while the color-coded bar refers to the N-3′.

