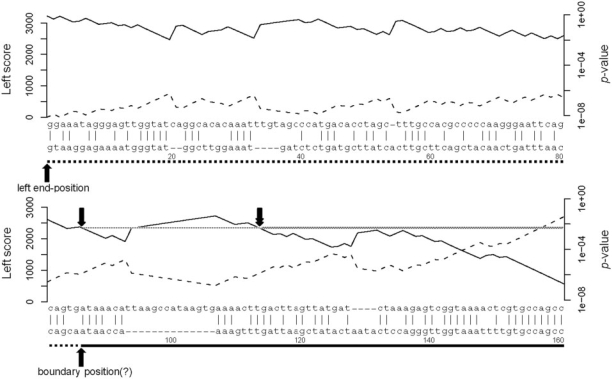
Figure 2.
Overalignment P-values for the start of the fugu–human alignment in Figure 1. The upper sequence is from the fugu mitochondrial chromosome, and the lower sequence is from human chromosome 2. (The alignment extends further to the right than shown in Figure 2.) The solid line under the human sequence indicates the region aligning to the dog, rat and mouse mtDNA; the dotted line, the putative spurious left flank starting at the boundary position (marked with ‘?’, to indicate its putative nature). The dashed line shows the cumulative alignment score, starting with zero at the left, using the HoxD55 matrix with GOP = 400, GEP = 30. The solid line shows the probability of obtaining this score or greater by alignment of two random sequences, from the formula P ≈ ceλy for the cumulative alignment score y. The single downward arrow indicates the P-value P at the boundary position, between 10−2 and 10−3. Trimming the left flank at P-value P requires trimming to the rightmost occurrence of the P-value P, indicated by the downward double arrow. (As an aside, the alignment would still match reasonably well if it moved the first seven human bases after the boundary position to the other end of the large gap, perhaps supporting the undependability of the alignment to the left of the downward double arrow).

