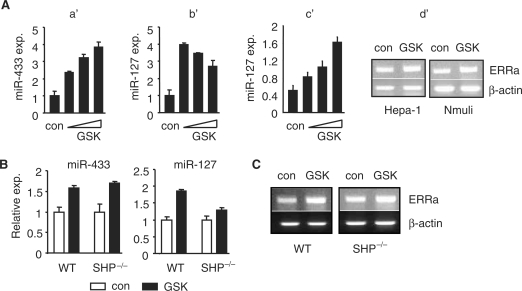
Figure 6.
(A) Real-time PCR analysis of miR-433 and miR-127 expression in Hepa-1 cells that were treated with the ERRγ agonist GSK4716 (a′ and b′: 5, 10 and 20 μM; c′: 1, 2.5 and 5 μM). con, solvent (ethanol). d′: semi-quantitative PCR analysis of ERRα expression in Hepa-1 and Nmuli cells treated with GSK4716 (2.5 μM). (B) Real-time PCR analysis of miR-433 and miR-127 expression in the livers of WT and SHP–/– mice in vivo administrated GSK4716. (C) Semi-quantitative PCR analysis of ERRα expression in the livers of WT and SHP–/– mice in vivo administrated GSK4716.

