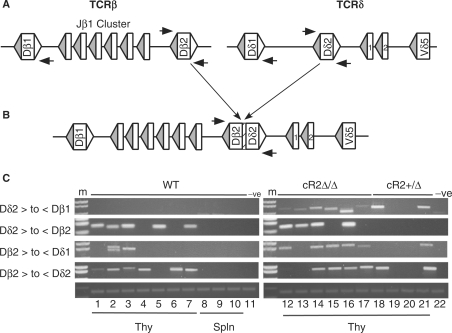
Figure 7.
Interchromosomal rearrangements (translocations) between TCRβ and TCRδ D gene segments. (A) Diagram of the germline configurations of the TCRβ (left) and TCRδ (right) loci. Rectangles represent coding gene segments (D's as marked and J's numbered) bounded by RSS-12 (filled) and RSS-23 (open) triangles. Nested amplifications were directed by primers (horizontal arrows) adjacent to the four D gene segments. (B) Diagram of a translocation between Dβ2 and Dδ2 resulting in a coding joint complete with N-region (hatched). (C) Agarose gel analyses of PCR products from reactions programmed with cR2 (homozygous or heterozygous) or WT genomic DNA purified from thymocytes (lanes 1–7 and 12–21) or splenocytes (lanes 8–10) from individual mice, or 63-12 (RAG2-null negative control) cell line DNA as indicated. PCR primer directions are given as forward (>) or reverse (<) for D gene segments indicated. Joint structures were confirmed by DNA sequence analysis (Supplementary Table S3).

