
Figure 4. Binding of L-CaM to IQ12 and IQ23 as determined by FRET.
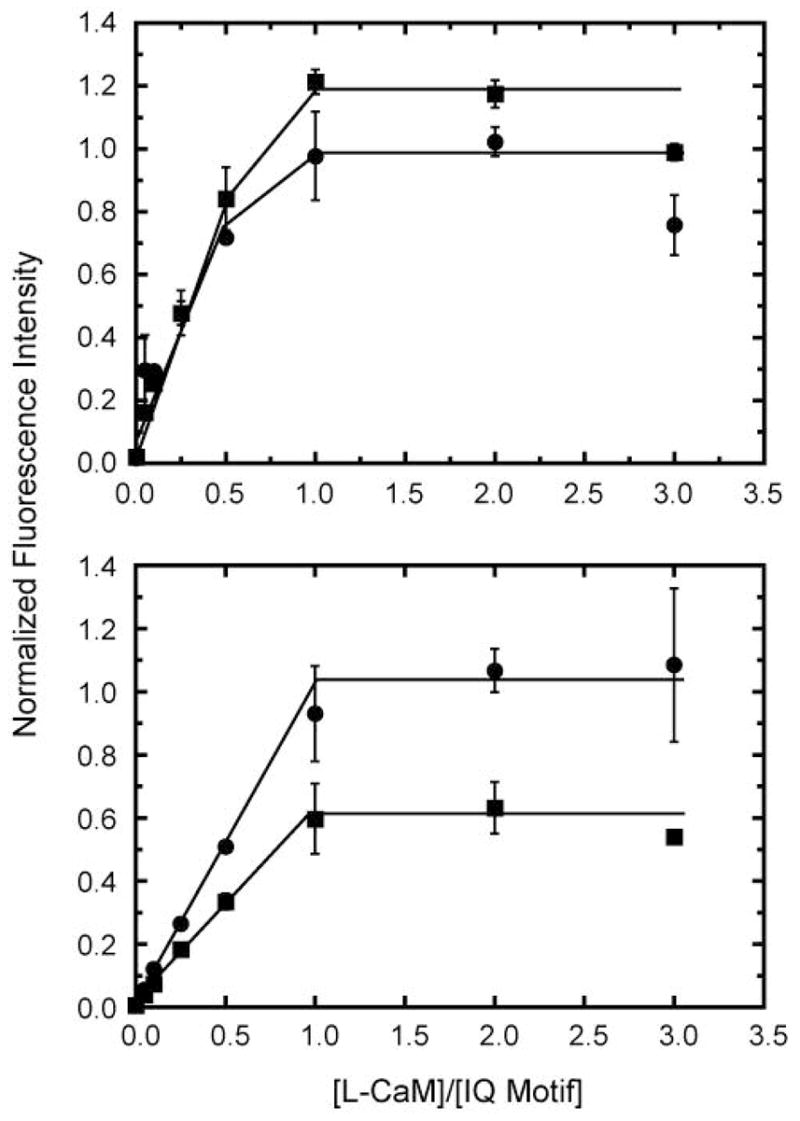
FRET emission intensity (λex = 295 nm, λem = 490 nm) of 0 – 3 μM L-CaM and (top) 0.5 μM IQ12 and (bottom) 0.5 μM IQ23 in the (●) absence and (■) presence of 100 μM free calcium. Lines are drawn by eye and show stoichiometric binding of calmodulin to the IQ motifs.