
Figure 5. Kinetics of L-CaM binding to IQ12 and IQ23.
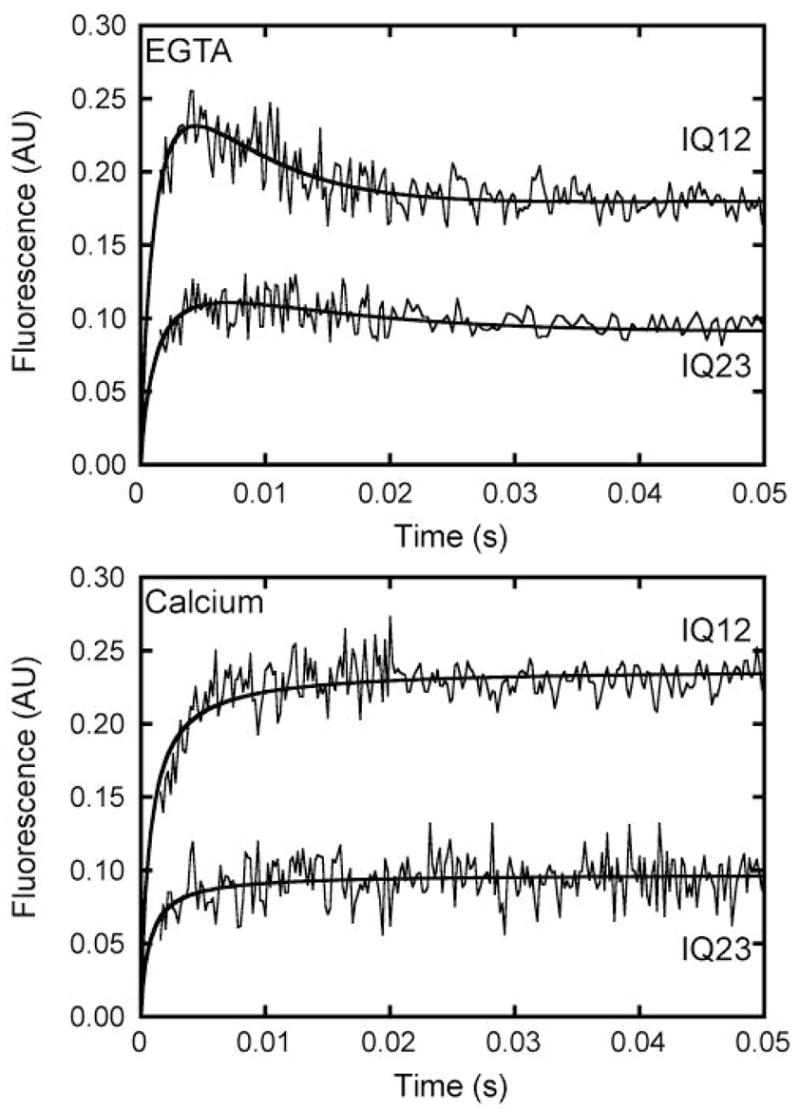
Time courses of FRET emission intensity obtained after mixing 0.05 μM IQ12 or IQ23 with 0.1 μM L-CaM in the (Top) absence or (Bottom) presence of 100 μM free calcium. The solid lines are the best fits to the data as described in the text. Transients are the averages of 14 – 26 individual traces.