
Figure 6. Kinetics of L-CaM dissociation from IQ12 and IQ23.
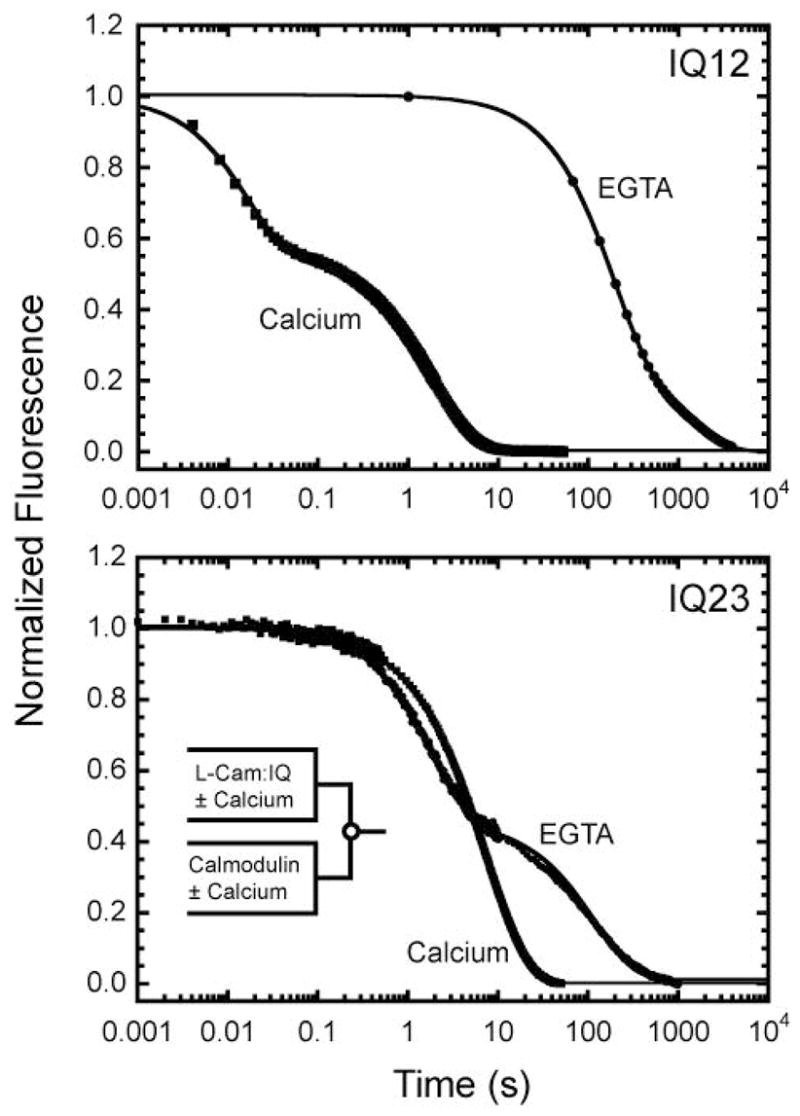
Time courses of FRET emission intensity obtained after mixing equilibrated mixtures of 1.25 μM L-CaM plus (top) 0.5 μM IQ12 or (bottom) 0.5 μM IQ23 in the absence or presence of 100 μM free calcium with a 50-fold excess of unlabeled calmodulin. Solid lines are the best fits to two exponential rate functions. Transients are the averages of five traces.