
Figure 7. Kinetics of calcium-induced dissociation of calmodulin from IQ12.
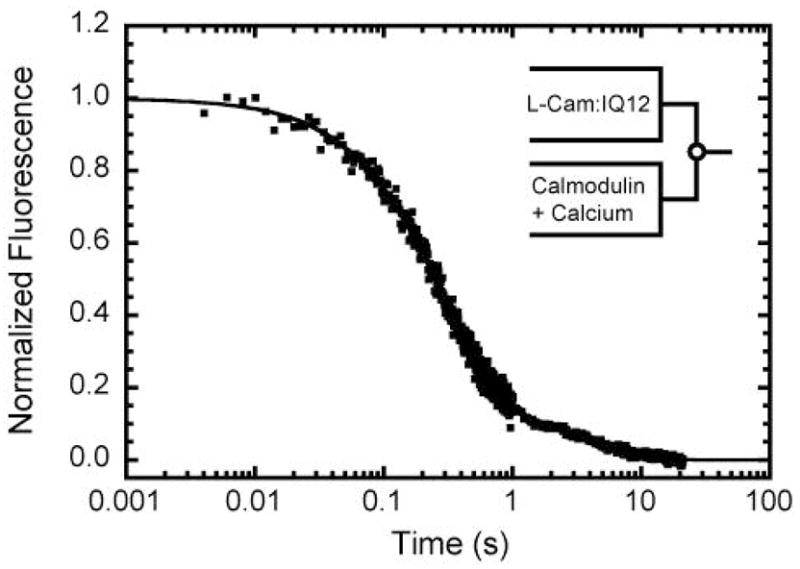
Time course of FRET emission intensity obtained after mixing an equilibrated mixture of 0.75 μM L-CaM and 0.3 μM IQ12 with a 50-fold excess of unlabeled calmodulin and 100 μM free calcium. The solid line is the best fit to a two exponential rate function.