
Figure 8. Time-resolved fluorescence anisotropy.
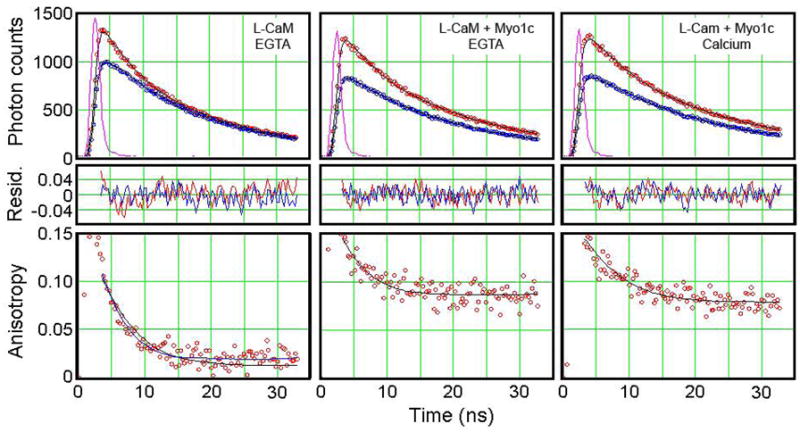
(Top) Time course of fluorescence decay after brief excitation at 337 nm. The samples were L-CaM in the absence of myo1cIQ1-3 (left), L-CaM in the presence of myo1cIQ1-3 and 1 mM EGTA (center), and L-CaM in the presence of myo1cIQ1-3, 1.1 mM calcium, and 1 mM EGTA (right). The instrument response function (IRF) is the ~2 ns intensity spike near zero time. The upper red decay curve in each panel is IVV and the lower blue decay curve is IVH. Symbols are the recorded intensities and the lines are the convolutions of the IRF with a restricted rotational diffusion model. (Center) Plots of normalized residuals [(photon counts - fit)/fit]. (Bottom) Time-resolved anisotropies calculated with a restricted rotational diffusion model with r(0) and r(∞) values given in the text (solid black lines). A model assuming a single rotational decay for L-CaM in the absence of myo1cIQ1-3 (blue line) gives identical results.