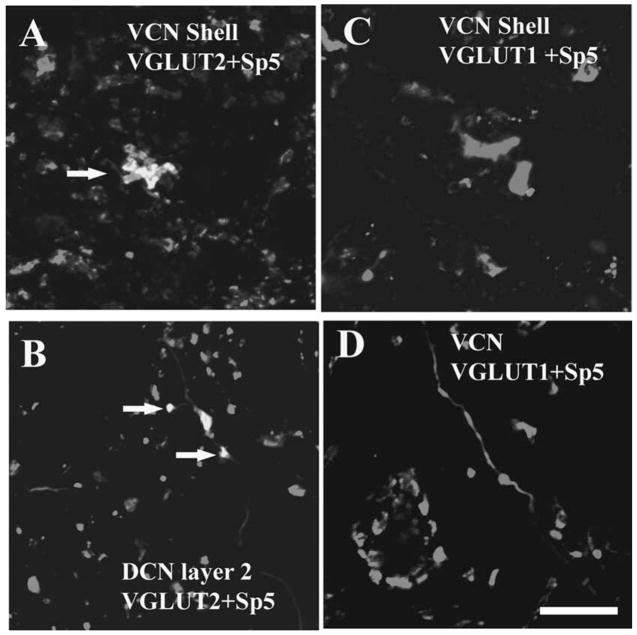
Fig. 2.
High magnification confocal images (63×) showing colocalization of anterogradely labeled Sp5 terminal endings with VGLUT2-ir in the CN. Green, VGLUT-ir. Red, Sp5 labeling. Yellow, double labeled terminals. Figures were obtained from Z projections of stacks of serial 1 μm confocal images. (A) MFs are labeled with BDA from Sp5 and VGLUT2 in the shell region of the VCN (arrow). (B) Small boutons are labeled with BDA from Sp5 and VGLUT2 in the DCN layer 2 (arrows). (C and D) Sp5 terminal endings do not colabel with VGLUT1 in the shell region of the VCN and the core of the VCN. Scale bar = 10 μm in D (applies to A–C). (See Color Plate 10.2 in color plate section.)

