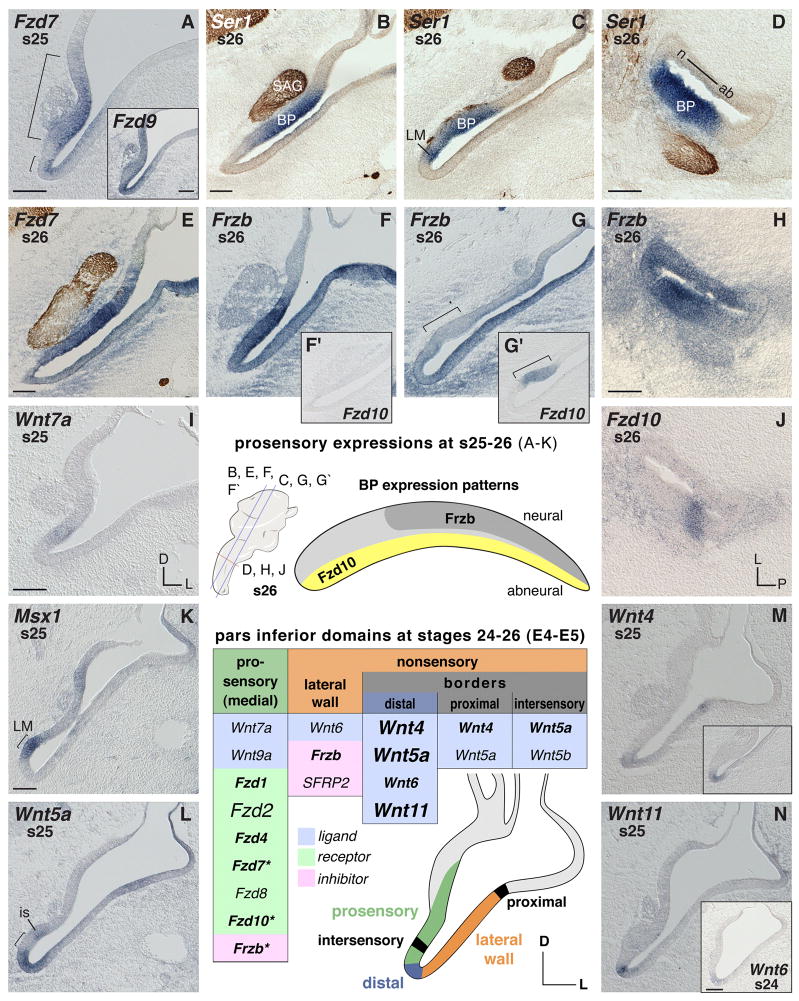
Fig. 1. Ventral ear (pars inferior) mRNA expression between s24–26 (E4–5).
In situ hybridization signals (purple) are exemplarily counterstained by labeling of neurofilament (brown) with neurofilament-associated 3A10 antibody in sample images. A–K: Expression in prosensory pars inferior areas. Brackets in A demarcate prosensory regions of the medial pars inferior. A insert: Broad expression of Fzd9 in the ventral otic anlage. B–D: Two independent markers reveal pro-sensory areas: Ser1 (purple), and for neuronal processes, NF-antibody 3A10 (brown). B and C: Two section levels of the same ear through the anterior-basal half and posterior-distal basilar papilla (BP) plus lagenar macula (LM), respectively. E, F, and F′: Anterior section level through the neural-basal half of the BP showing strong expression of Fzd7 and Frzb, while Fzd10, F′, is negative in the neural-basal half of the BP. G and G′: Posterior section level through the abneural pars inferior and the distal BP (bracket) of the same ear, respectively, showing weak Frzb and distinct Fzd10 expression. F and G: Lateral nonsensory pars inferior expresses Frzb. H and J: Cross sections reveal local concentration of Frzb and Fzd10 transcripts in the BP (compare to D; these three are consecutive sections of the same ear). H: Lateral nonsensory pars inferior expresses Frzb. BP shows Frzb expression gradient with highest concentration in the anterior-neural two-thirds. J: Local expression of Fzd10 in the abneural BP. I: Weak expression of Wnt7a in the prosensory pars inferior. K: Msx1 probe used as marker to reveal the LM prosensory patch (bracket). L–N: Wnt expression in border domains. L: Wnt5a transcripts flank the LM (bracket) (compare to K). Abbreviations: ab, abneural; BP, basilar papilla; D dorsal; is, intersensory domain; L, lateral; LM, lagenar macula; n, neural; P, posterior; s, stage; SAG, stato-acoustic ganglion. Each scale bar equals 100μm and applies to consecutive images including inserts, unless otherwise indicated. Center: Orientation and section levels for s26 images are indicated in the cartoon of the otic anlage, lateral view (left); a map of the complementary gene expressions (Frzb and Fzd10) is shown in the schematic outline of the BP (right).
Summary table s24–26 (E4–5): Otic epithelium domains express the listed genes. Table headers refer to otic domains shown in the color-coded schematic. Gene expression over the summarized time span is categorized by different font sizes and font faces to indicate distinct versus weak or temporally-varying expression, as follows: Font face (bold/plain) refers to signal strength: bold indicates obvious (high signal-to-noise) labeling; plain indicates weaker detection or lower signal-to-noise labeling. Relative signal strengths may be probe-dependent and do not necessarily reflect quantitative differences across probes. Font size (small/large) refers to either duration of the expression or local restriction: small means not continuously expressed over the time window covered in this panel description or the gene is expressed only in particular regions of that domain; large refers to broad expression within the domain. Summary table s24–26 (E4–5), does not list Dkk1, Fzd9, Wnt7b that are broadly expressed in the ventral otic anlage and therefore are not specific for a particular domain. Asterisks label genes with local expression or a gradient along and across the BP primordium (see text).

