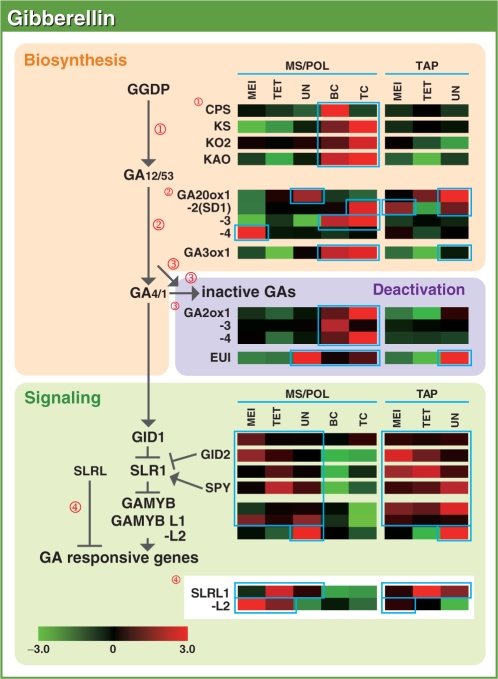
Fig. 1.
Representative gene expression profiles of the GA biosynthesis, deactivation and signaling pathways in the MS/POL and TAP of rice. Red and green colors indicate higher and lower expression, respectively. The color scale (representing the average log2 Z-value normalized by R software) is shown at the bottom. The letters ‘Os’ at the beginning of each gene are omitted for convenience. MS/POL, microspore/pollen; TAP, tapetum; MEI, meiosis, TET, tetrad stage; UN, uninuclear MS stage; BC, bicellular POL stage; TC, tricellular POL stage.

