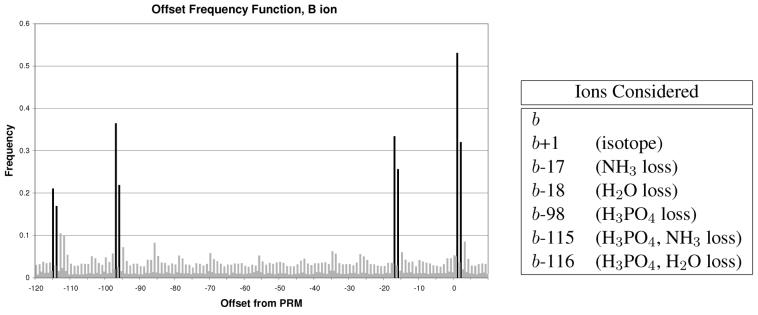
Figure 3.
The offset frequency function of b ions. Offsets from the prefix residue mass are plotted.27 Offsets in black are the regularly occurring ions included in the model. Offsets in gray are not included. The strong gray offsets (e.g., −113) were discovered to be parts of the b/y ladder and not a novel neutral loss. Differentiating offsets caused by regularly occurring neutral losses from offsets caused by neighboring b peaks was done by iteratively removing the strongest offset from the spectra and repeating the analysis.

