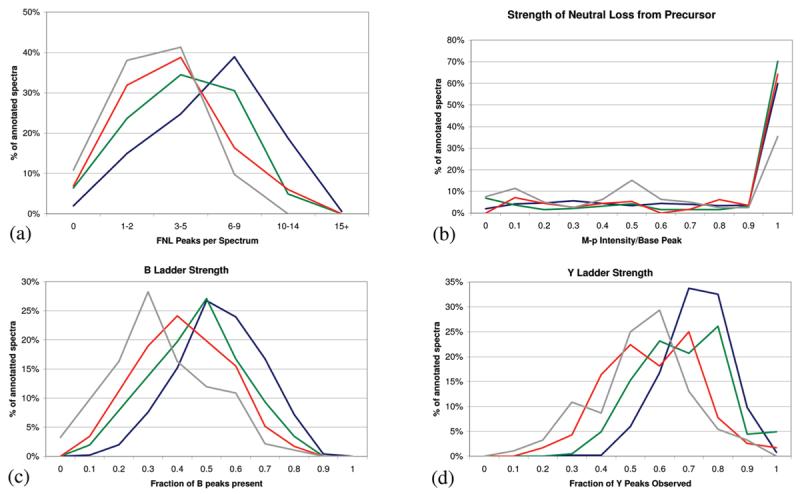
Figure 6.

Phosphopeptide spectral qualities. For each plot, the spectral quality feature was tabulated for all spectra in the testing data set. The blue line represents spectra annotated by all programs (consensus spectra). The green line represents spectra uniquely annotated by Inspect, red for unique SEQUEST annotations, and gray for unique X!Tandem annotations. Each figure shows the overlaid histogram of the results. (a) Number of fragment neutral loss peaks per spectrum. (b) Intensity of the M − p peak compared to the base peak of the spectrum. (c) Strength of the b ion ladder. (d) Strength of the y ion ladder.
