
Fig. 5. Modulation of BAD subcellular localization with varying expression of SIRT2.
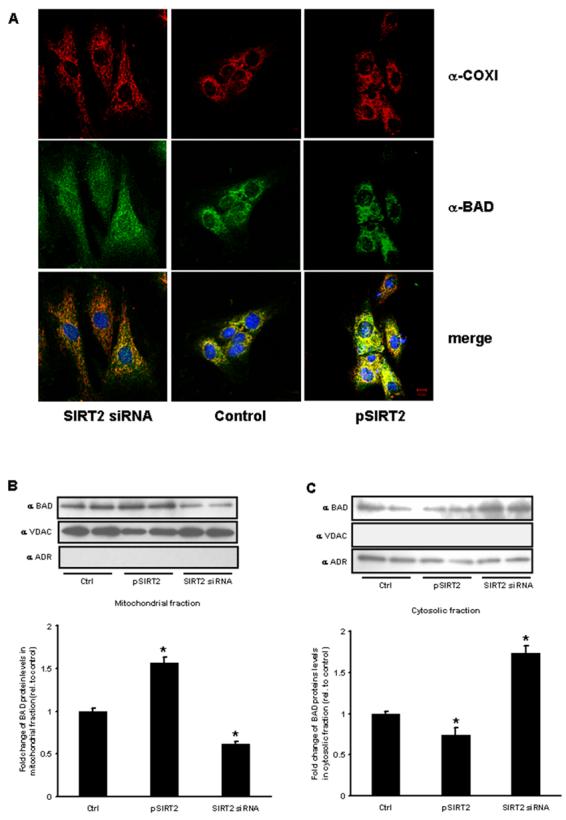
(A) SIRT2 siRNA-treated (left column), control siRNA-treated (middle column) and pSIRT2-transfected H9c2 cells (right column) were stained with anti-COXI (red) and anti-BAD (green) antibodies. The lower panels are merged images. DAPI staining (blue) is used to visualize nuclei. Scale bar, 10 μm. Subcellular fractionation for western blot analysis show reduced BAD in the mitochondrial fraction (B) and increased cytosolic levels (C) following SIRT2 siRNA and the reciprocal localization following SIRT2 overexpression. VDAC – (voltage dependent anion channel – mitochondrial enriched) and ADR – (aldose reductase is cytosolic). (n=3 per group, p<0.05 versus scrambled siRNA and empty vector controls).