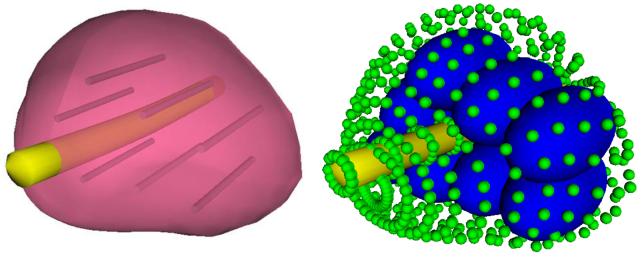
Figure 3.
Illustration of boundary representation for bubble packing: the contour of the reconstructed prostate model (left) is replaced with boundary bubbles (small bubbles on the right), and cryoprobe representing bubbles (large bubbles on the right) are packed in the domain; the size of the infinitesimal boundary bubbles is enlarged for illustration purposes. Also illustrated on the left are the active surfaces of cryoprobes, based on the bubble-packing results.

