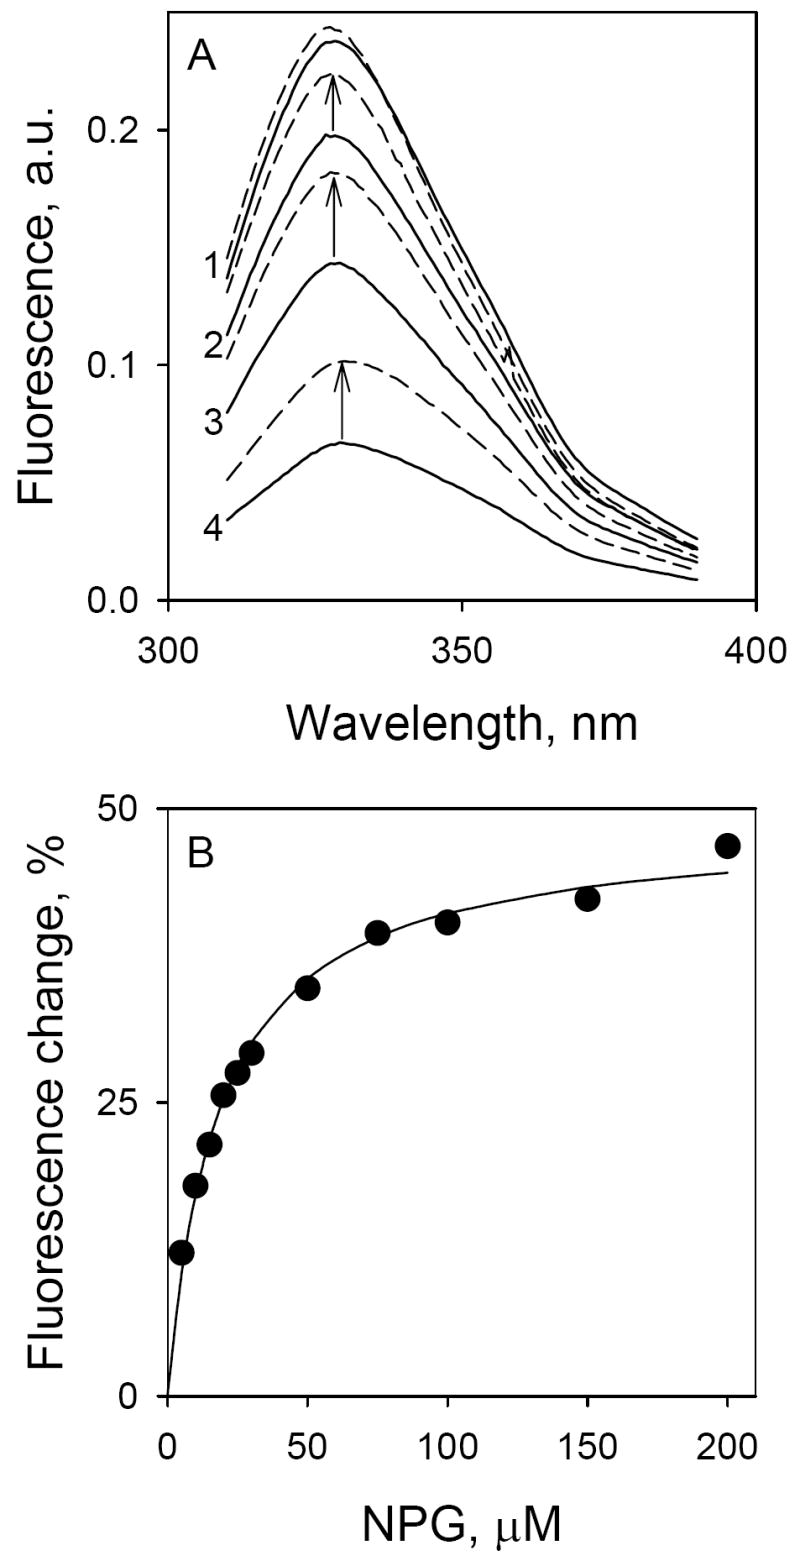
Figure 2.

Binding of α-NPG to C154G LacY as detected by Trp→α-NPG FRET. Measurements were carried out in 50 mM NaPi (pH 7.5)/0.02% DDM at a protein concentration of 0.4 μM; excitation was at 295 nm. A. Trp emission spectra at different concentrations of α-NPG. Solid lines represent Trp fluorescence at increasing α-NPG concentrations: line 1, protein without α-NPG; line 2, 5 μM α-NPG; line 3, 15 μM α-NPG; line 4, 50 μM α-NPG. Arrows indicate change of fluorescence after displacement of bound α-NPG by addition of 10 mM TDG. Broken lines, spectra after addition of TDG. B. Affinity of C154G LacY for α-NPG measured by displacement with TDG. The fluorescence change after addition of 10 mM TDG (shown as arrows in panel A) plotted as a function of α-NPG concentration. Fluorescence after TDG addition was taken as 100% at each α-NPG concentration. Solid line shows hyperbolic fit to the data with estimated KD = 19 ± 2.0 μM.
