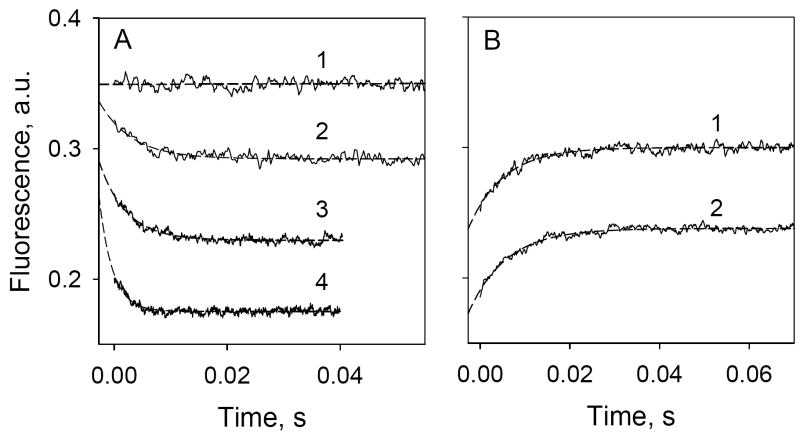
Figure 4.
Stopped-flow Trp→ α-NPG FRET. Trp fluorescence changes with time were recorded after rapid mixing of purified C154G LacY with ligand in 50 mM NaPi (pH 7.5)/0.02% DDM. Excitation and emission wavelengths were 295 and 330 nm, respectively. Stopped-flow traces (average of 5-7 measurements shown as solid lines) were fit using a single exponential equation and corrected for the instrument dead-time of 2.7 ms (broken lines). Final protein (1 μM) and sugar concentrations are given after mixing. A. Trp→ α-NPG FRET after mixing protein with buffer only (1), 10 μM α-NPG (2), 25 μM α-NPG (3) or 50 μM α-NPG (4). Estimated rates (kobs) are 170 s-1, 210 s-1, and 420 s-1 for 10 μM, 25 μM, and 50 μM α-NPG, respectively. B. Displacement of bound α-NPG by excess TDG. Traces were recorded after mixing a saturating concentration of TDG (15 mM) with protein pre-incubated with α-NPG. α-NPG concentrations were 25 μM (1) and 50 μM (2). Estimated kobs are 128 and 122 s-1 for 25 and 50 μM α-NPG, respectively.

