
Figure 6.
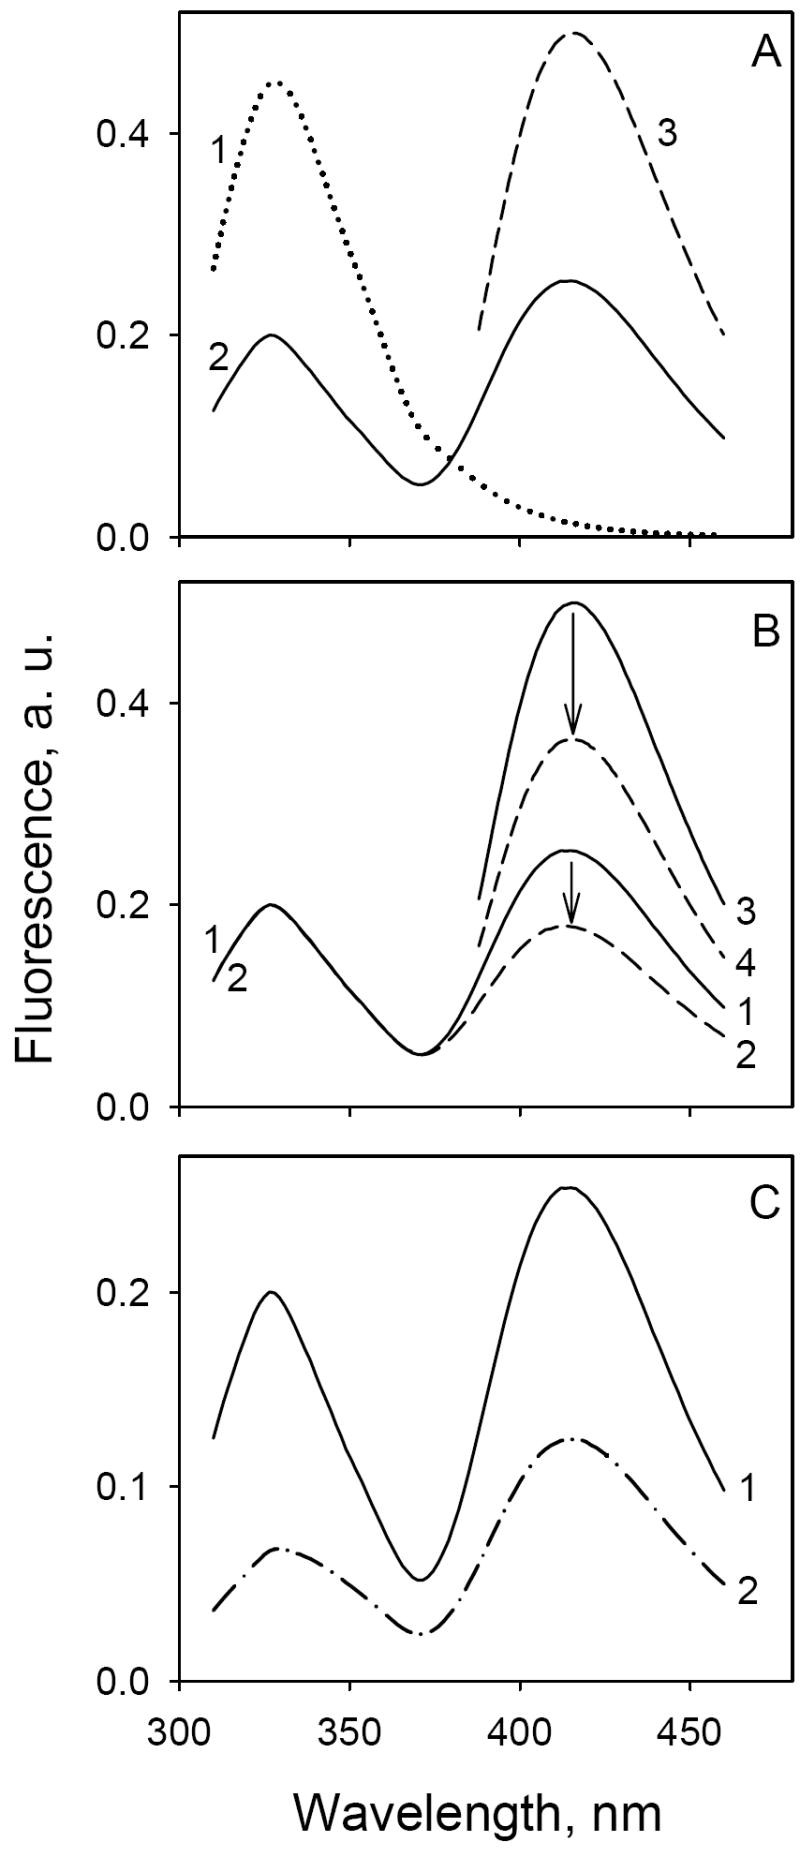
Trp→ α-NPG FRET and α-NPG-induced fluorescence change in MIANS-labeled C154G/V331C LacY. Emission spectra were recorded in 50 mM NaPi (pH 7.5)/0.02% DDM at 0.6 μM final protein concentration. A. Fluorescence of unlabeled (line 1) or MIANS-labeled (lines 2, 3) LacY without sugar; excitation wavelengths 295 nm (lines 1, 2) or 330 nm (line 3) for Trp→ α-NPG FRET or MIANS fluorescence, respectively. B. TDG effect on the fluorescence of MIANS-labeled C154G/V331C LacY; excitation at 295 nm (lines 1,2) or 330 nm (lines 3,4). Solid lines, no TDG; broken lines, addition of 15 mM TDG. The fluorescence change indicated by arrows is 30% in both cases. C. α-NPG effect on fluorescence of MIANS-labeled LacY with excitation at 295 nm: line 1, no α-NPG; line 2, addition of 50 μM α-NPG.