
Figure 7.
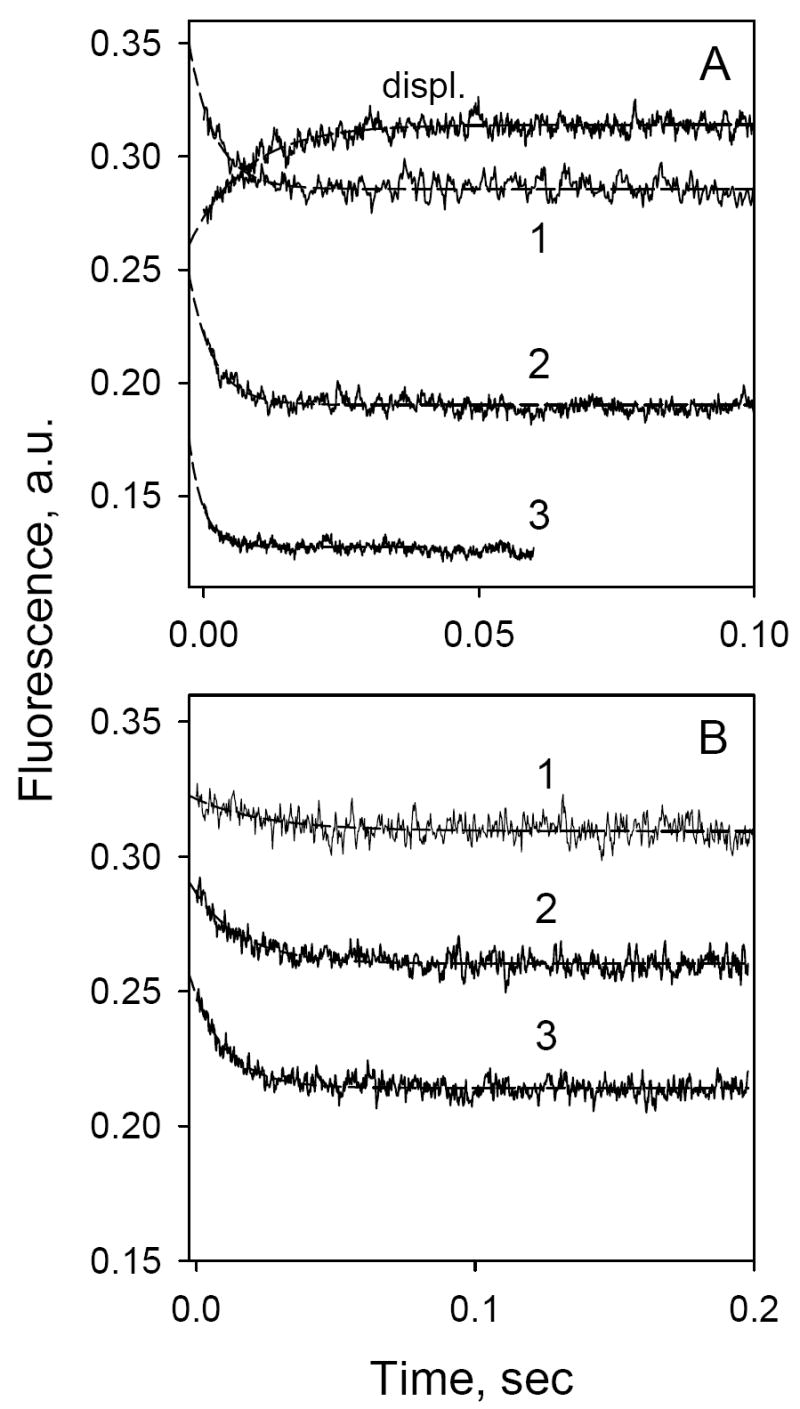
Time-dependent changes in Trp→ α-NPG FRET (A) or MIANS fluorescence (B) with MIANS-labeled C154G/331C LacY. Stopped-flow traces were recorded after rapid mixing of protein (1 μM, final concentration) with α-NPG at excitation and emission wavelengths of 295 and 330 nm (A) or 330 and 415 nm (B), respectively. α-NPG concentrations were: 20 μM (1), 50 μM (2) or 100 μM (3). The upper trace in panel A represents displacement of bound α-NPG (25 μM) by excess of TDG (15 mM). Other experimental details are described in Figure 4. Estimated rates (kobs) are 210 s-1, 230 s-1 and 380 s-1 for traces 1, 2 and 3 in panel A, and 40 s-1, 58 s-1 and 82 s-1 for traces 1, 2 and 3 in panel B, respectively.