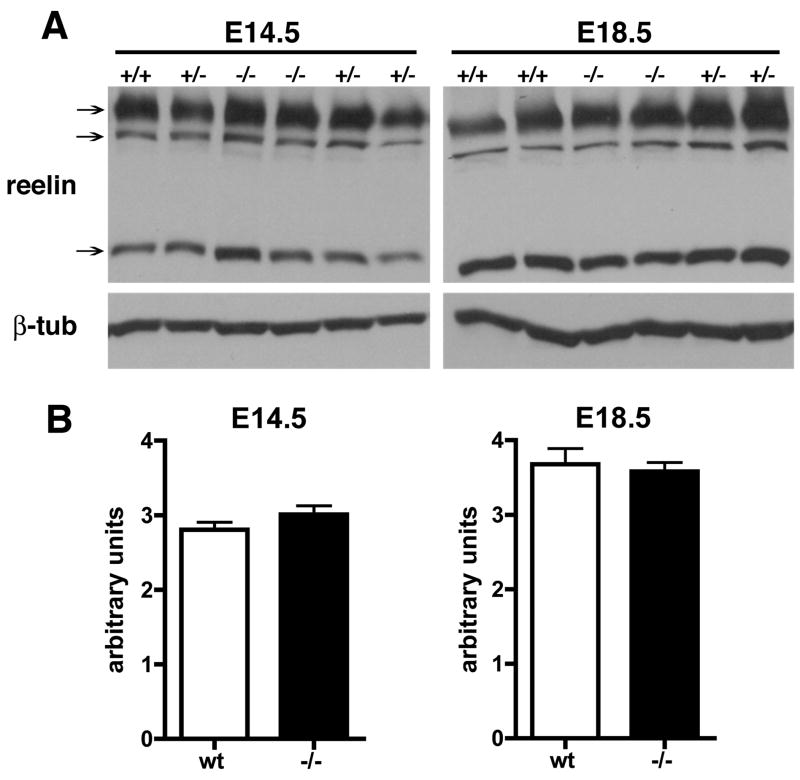
Fig. 2.
No change in reelin levels in Psen1−/− brain. Reelin levels were determined by Western blotting (A) of extracts from E14.5 or E18.5 brain from wild type (+/+), heterozygous (+/−), or homozygous (−/−) Psen1 mutant mice. Arrows indicate the ≈180, 250 and 400 kDa reelin bands. Lower panel shows the same blot reprobed for β-tubulin. In (B) reelin levels were quantitated as a ratio of the sum of the three reelin bands to β-tubulin (n = 4 wild type and 2 Psen1−/− at each age). There were no differences between wild type (wt) and Psen1−/− at either age.

