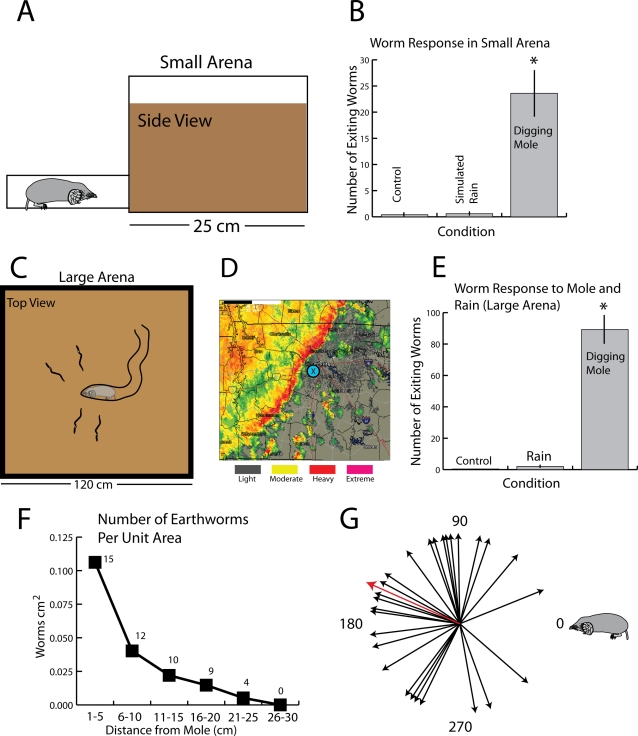
Figure 5. Summary of experiments examining earthworm responses.
A. Preliminary tests were performed in a small arena (20 w×25 l×19 h cm) containing soil and 50 Diplocardia earthworms. The mole entered through a tube in the lower corner and observations were made for 1 hour. B. Histogram illustrating responses. In 5 trials, each lasting 1 hour, an average of 23.6 earthworms exited to the soil surface, usually shortly after the mole entered and disturbed the soil. Movie S2 shows the first part of one trial. The control period was a 1 hour interval prior to the test. Simulated rain consisted of a sprinkler system that provided a simulated downpour at a rate of 1 inch per minute as measured by a rain gage. * indicates significant difference between digging mole and other conditions (F (2,12) = 26.44, p<0.0001). Bars are SEM. C. Schematic illustration (top view) of the large, outdoor arena (1.2×1.2 m filled to a depth of approximately 15 cm) used for a more natural setting. D. Weather radar showing the relative rainfall for a thunderstorm on April 1st, 2008, 00:31 hours, during which observations of Diplocardia responses were made. Observations were made during the first hour of rainfall for each trial (rainfall was continuous) and included periods of moderate and heavy rain. X marks the approximate location of the outdoor arena. E. Responses of earthworms in the large arena to a digging mole for 1 hour (5 trials) and 1 hour of moderate to heavy rain (3 trials). See movies S3 and S4 for responses to digging moles. * indicates significant difference between digging mole and other conditions (F (2,10) = 70.66, p<0.0001). Bars are SEM. F. The number of worms that emerged at different distances from the mole for 50 observations. Y-axis units represent worms per unit area as summed for the 50 trials (and thus are arbitrary). Numbers for each square represent the raw total of worms for each distance. G. Summary of the directional preference for movement of the escaping worms for 30 observations. The earthworms had a significant direction preference (Rayleigh test P = 0.034; Z = 3.33) with a mean vector of 156 degrees (mole at zero degrees) as indicated by the red arrow.

